The ZAD Forex indicator for MT4 is a complete trading system that delivers great entry & exit signals for any currency pair.
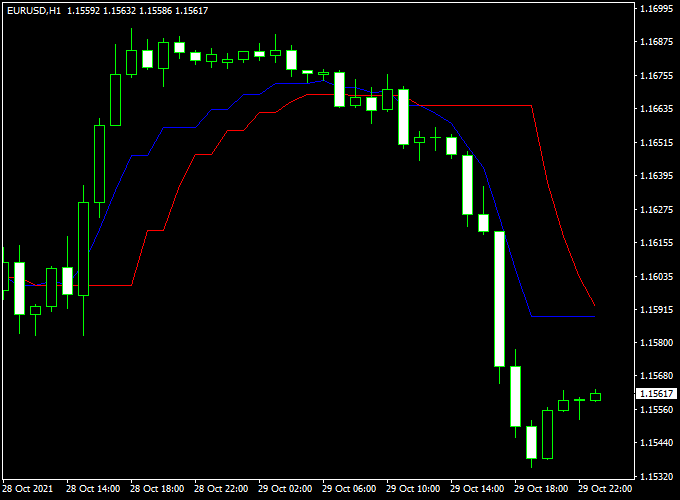
The indicator pops up in the main chart as a red/blue colored crossover trading system.
The ZAD Forex system delivers the best performance during trending markets.
Key Points:
- A buy trend occurs whenever the ZAD blue signal line crosses the red signal line upwards.
- A sell trend occurs whenever the ZAD red signal line crosses the blue signal line upwards.
For scalping and day trading, it’s recommended to utilize the indicator in the London and U.S. trading sessions for best performance.
For swing trading (H1, H4 and D1 charts), it can be uses across all trading sessions without any problem.
Free Download
Download the “ang-zad-indicator.mq4” indicator for MT4
Indicator Example Chart (EUR/USD H1)

How to trade with it (example)?
Consider to open a long position as soon as the ZAD blue signal line crosses above the red signal line.
Consider to open a short position as soon as the ZAD red signal line crosses above the blue signal line.
Exit the trade when an opposite trading signal appears on the chart, or for a fixed profit target of your preference.
Set a stop loss above or below the previous swing high or low price.
Feel free to use your own favorite trading method to open and close trades with the ZAD Forex indicator.
Indicator Specifications
Trading Platform: Developed for Metatrader 4 (MT4)
Currency pairs: Works for any pair
Time frames: Works for any time frame
Input Parameters: Ki, color settings & style
Indicator type: trend
Repaint? Does not repaint the blue and red colored ZAD signal lines.
Download Now
Download the “ang-zad-indicator.mq4” indicator for Metatrader 4
Installation:
Open the Metatrader 4 platform
From the top menu, click on “File”
Then click on “Open Data Folder”
Then double click with your mouse button on “MQL4”
Now double click on “Indicators”
Paste the ang-zad-indicator.mq4 indicator in the Indicators folder.
Finally restart the MT4 platform and attach the indicator to any chart.
How to remove the indicator?
Click with your right mouse button in the chart with the indicator attached onto it.
Select “Indicator List” from the drop down menu.
Select the indicator and press delete.
How to edit the indicator’s inputs and parameters?
Right click with your mouse button in the chart with the indicator attached onto it.
From the drop down menu, click on indicators list.
Select the indicator from the list and press edit.
Now you can edit the indicator.
Finally, press the OK button to save the updated configuration.