The XO Forex Trend indicator for Metatrader 5 follows the trend for any time frame and delivers fast buy & sell signals for scalpers and day traders.
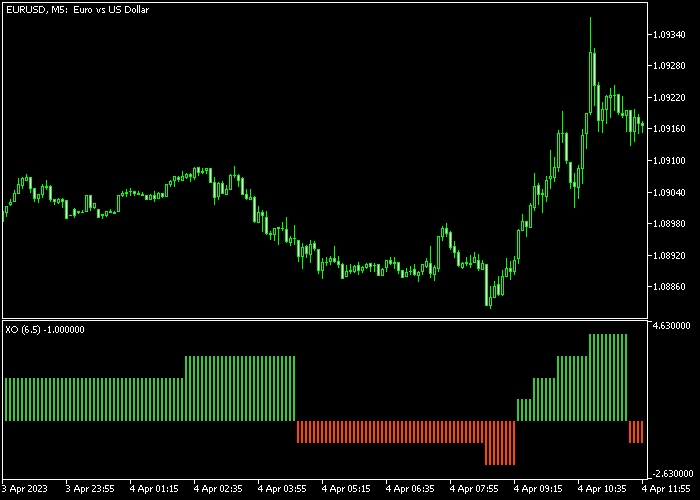
The indicator is displayed in a separate chart window as an oscillator that oscillates above and below the zero level.
To make it easy for the trader, a green colored box is bullish while a red colored box bearish.
XO indicator tips:
- XO works the best for scalpers and day traders, and less for swing traders.
- For best trading results, deploy it on the lower spread currency pairs.
The indicator contains the following inputs and parameters: box size, price, and style.
First, familiarize yourself with this technical indicator and test it on a demo account.
It supports all time frames and Forex pairs.
Download Indicator 🆓
Chart Example
The following chart shows how the XO Trend indicator looks when applied to the MT5 chart.

How To Buy And Sell Forex Pairs With The XO Forex Trend Indicator?
Find a simple trading example below:
Buy Signal
- The first green colored bar is a buy signal.
- Open a buy trade and set your stop loss 2-3 pips below short-term support.
- Exit the buy trade for 6-20 pips profit (depends on your chosen time frame).
Sell Signal
- The first red colored bar is a sell signal.
- Open a sell trade and set your stop loss 2-3 pips above short-term resistance.
- Exit the sell trade for 6-20 pips profit (depends on your chosen time frame).
Download Now 🆓
Frequently Asked Questions
How Do I Install This Custom Indicator On Metatrader 5?
- Open the MT5 trading platform
- Click on the File menu button located at the top left part of the platform
- Click on Open Data Folder > MQL5 folder > Indicators
- Copy the XO.mq5 indicator file in the Indicators folder
- Close and restart the trading platform
- You will find the indicator here (Navigator window > Indicators)
- Drag the indicator to the chart to get started with it!
How Do I Edit This Indicator?
- Click in the open chart with your right mouse button
- In the dropdown menu, click on Indicator List
- Select the indicator and click on properties
- Now you can edit the inputs, colors, levels, scale and visualization
- Finally click the OK button to save the new configuration