The Volume Flow Oscillator (VFO) for Metatrader 5 creates fast oscillating signals based on market volume and a smoothing period.
This indicator provides bullish and bearish trade entry signals in a sub-chart window.
Generally speaking:
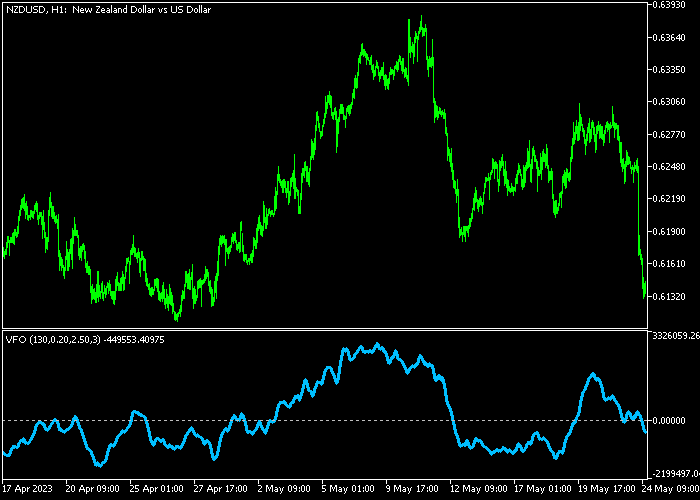
- The blue colored VFO line above 0 is a bullish signal.
- The blue colored VFO line below 0 is a bearish signal.
The following indicator inputs and parameters can be modified: period, volume coefficient, smoothing period.
The indicator works for any trading instrument (Forex, Stocks, Indices, Metals, etc.) that can be loaded into the Metatrader 5 platform.
Please make yourself familiar with this technical indicator and test it first on a demo account before using it on a real trading account.
It supports all time frames and Forex pairs.
Download Indicator 🆓
Chart Example
The following chart shows what the Volume Flow Oscillator (VFO) indicator looks like when applied to the MT5 chart.

How To Buy And Sell Forex Pairs With The Volume Flow Oscillator (VFO)?
Find a simple trading example below:
Buy Signal
- A long trade signal occurs when the blue VFO line crosses the 0 level bottom up.
- Open a buy trade and place your stop loss 2-3 pips below the previous swing low.
- Close the buy trade for a risk/reward ratio of at least 1, or wait for a sell signal.
Sell Signal
- A short trade signal occurs when the blue VFO line crosses the 0 level top down.
- Open a sell trade and place your stop loss 2-3 pips above the previous swing high.
- Close the sell trade for a risk/reward ratio of at least 1, or wait for a buy signal.
Download Now 🆓
Frequently Asked Questions
How Do I Install This Custom Indicator On Metatrader 5?
- Open the MT5 trading platform
- Click on the File menu button located at the top left part of the platform
- Click on Open Data Folder > MQL5 folder > Indicators
- Copy the VFO.mq5 indicator file in the Indicators folder
- Close and restart the trading platform
- You will find the indicator here (Navigator window > Indicators)
- Drag the indicator to the chart to get started with it!
How Do I Edit This Indicator?
- Click in the open chart with your right mouse button
- In the dropdown menu, click on Indicator List
- Select the indicator and click on properties
- Now you can edit the inputs, colors, levels, scale and visualization
- Finally click the OK button to save the new configuration