
The TrendLord Forex indicator for Metatrader 5 is an oscillator that provides accurate buy & sell signals for any FX pair of your preference.
The indicator pops up in a separate chart as green and red colored histogram bars.
How to follow the trend with the TrendLord indicator?
- A green histogram bar indicates a bullish currency market.
- A red histogram bar indicates a bearish currency market.
The following indicator inputs and parameters can be adjusted: trend lord period, applied price.
The Trend Lord indicator works for any trading instrument that can be loaded in the Metatrader 5 platform.
First, familiarize yourself with this technical indicator and test it on a demo account.
Remember to have realistic expectations, performance will vary depending on market conditions.
Download Indicator 🆓
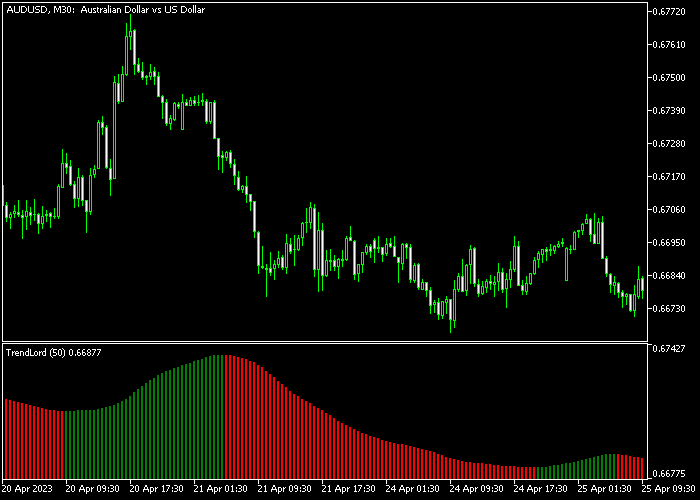
Chart Example
The following chart shows what the TrendLord Forex indicator looks like when applied to the MT5 chart.
How To Buy And Sell Forex Pairs With The Trend Lord Indicator?
Find a simple trading example below:
Buy Signal
- The first green colored TrendLord histogram bar is a buy signal.
- Open a buy order and place your stop loss 3 pips below technical support.
- Exit the buy trade for a fixed take profit of your preference, or wait for a sell signal.
Sell Signal
- The first red colored TrendLord histogram bar is a sell signal.
- Open a sell order and place your stop loss 3 pips above technical resistance.
- Exit the sell trade for a fixed take profit of your preference, or wait for a buy signal.
Download Now 🆓
Frequently Asked Questions
How Do I Install This Custom Indicator On Metatrader 5?
- Open the MT5 trading platform
- Click on the File menu button located at the top left part of the platform
- Click on Open Data Folder > MQL5 folder > Indicators
- Copy the TrendLord.mq5 indicator file in the Indicators folder
- Close and restart the trading platform
- You will find the indicator here (Navigator window > Indicators)
- Drag the indicator to the chart to get started with it!
How Do I Edit This Indicator?
- Click in the open chart with your right mouse button
- In the dropdown menu, click on Indicator List
- Select the indicator and click on properties
- Now you can edit the inputs, colors, levels, scale and visualization
- Finally click the OK button to save the new configuration