
The Trend Score indicator for Metatrader 5 is a technical oscillator that measures the intensity of a trend and it provides valuable buy/sell trading signals.
The indicator is displayed in a bottom chart window as a blue colored line that oscillates above and below the zero level.
Spotting bullish and bearish trends with this indicator:
- A bullish trend occurs when the blue indicator line turns back above zero.
- A bearish trend occurs when the blue indicator line turns back below zero.
The indicator contains the following inputs and parameters: price mode, period mode, period, and line style.
Make yourself familiar with this technical indicator and test it first on a demo account for an extended period.
Worth noting: scalpers and day traders can enhance their profit potential by utilizing the Trend Score indicator during the London and American trading hours.
Download Indicator 🆓
trendscore.mq5 Indicator (MT5)
Chart Example
The picture below shows how the Trend Score indicator looks like when applied to the MT5 chart.
How To Buy And Sell Forex Pairs With The Trend Score Indicator?
Find a simple trading example below:
Buy Signal
- A buy signal is confirmed when the Trend Score indicator crosses the zero level bottom up.
- Place a protective stop loss slightly below technical support.
- Close the buy trade for a predetermined pips target of your preference, or wait for a cross back below 0.
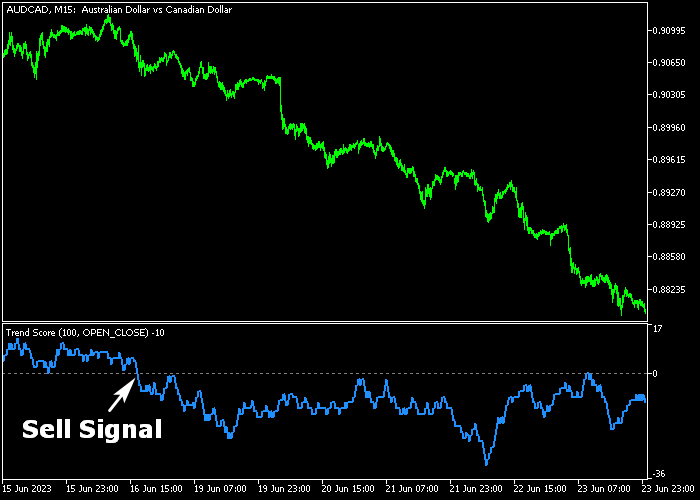
Sell Signal
- A sell signal is confirmed when the Trend Score indicator crosses the zero level top down.
- Place a protective stop loss slightly above technical resistance.
- Close the sell trade for a predetermined pips target of your preference, or wait for a cross back above 0.
Download Now 🆓
trendscore.mq5 Indicator (MT5)
Frequently Asked Questions
How Do I Install This Custom Indicator On Metatrader 5?
- Open the MT5 trading platform
- Click on the File menu button located at the top left part of the platform
- Click on Open Data Folder > MQL5 folder > Indicators
- Copy the trendscore.mq5 indicator file in the Indicators folder
- Close and restart the trading platform
- You will find the indicator here (Navigator window > Indicators)
- Drag the indicator to the chart to get started with it!
How Do I Edit This Indicator?
- Click in the open chart with your right mouse button
- In the dropdown menu, click on Indicator List
- Select the indicator and click on properties
- Now you can edit the inputs, colors, levels, scale and visualization
- Finally click the OK button to save the new configuration