The Trend Lines Crossing indicator developed for Metatrader 5 specializes in finding the best possible buy & sell trend lines for any time frame.
It gives you the opportunity to buy a break above the resistance trend line and sell a break below the support trend line.
The trading logic is straightforward:
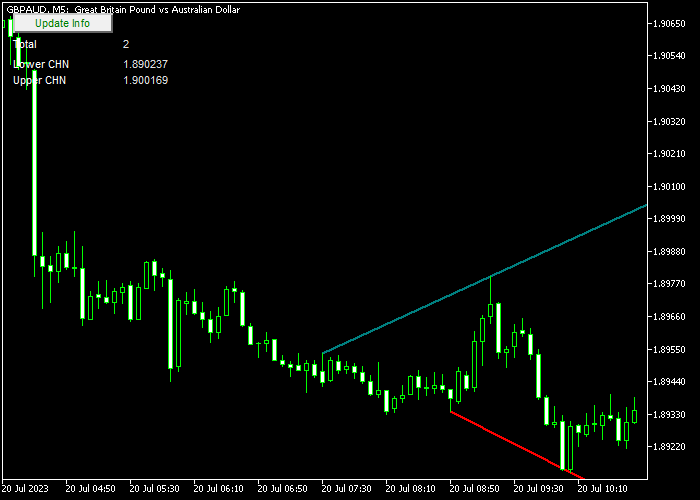
- The sea-green trend line represents resistance. Buy when the price breaks above this line.
- The red trend line represents support. Sell when the price breaks below this line.
You can customize the indicator according to your preferences by adjusting the following inputs and parameters: resistance trend line color, and support trend line color.
For optimal results, we recommend becoming familiar with the Trend Lines Crossing indicator and thoroughly testing it on a demo account.
This will help you gain confidence in its performance and understand its effectiveness in different market conditions.
Download Indicator 🆓
trendlinescrossing.mq5 Indicator (MT5)
Chart Example
The image below displays the appearance of the Trend Lines Crossing indicator on the MT5 charting platform.

How To Buy And Sell Pairs Utilizing The Trend Lines Crossing Forex Indicator?
Find a simple trading example below:
Buy Signal
- A buy signal is confirmed when the candle closes above the upper resistance trend line.
- Execute a buy trade and set a stop-loss order below the most recent support level.
- Close your buy position when the price reaches your predetermined profit target.
Sell Signal
- A sell signal is confirmed when the candle closes below the lower support trend line.
- Execute a sell trade and place a stop loss order above the most recent resistance level.
- Close your sell position when the price reaches your predetermined profit target.
Download Now 🆓
trendlinescrossing.mq5 Indicator (MT5)
Frequently Asked Questions
How Do I Install This Custom Indicator On Metatrader 5?
- Open the MT5 trading platform
- Click on the File menu button located at the top left part of the platform
- Click on Open Data Folder > MQL5 folder > Indicators
- Copy the trendlinescrossing.mq5 indicator file in the Indicators folder
- Close and restart the trading platform
- You will find the indicator here (Navigator window > Indicators)
- Drag the indicator to the chart to get started with it!
How Do I Edit This Indicator?
- Click in the open chart with your right mouse button
- In the dropdown menu, click on Indicator List
- Select the indicator and click on properties
- Now you can edit the inputs, colors, levels, scale and visualization
- Finally click the OK button to save the new configuration