The Timebox Breakout Mt4 indicator draws a box that marks the daily high and low price.
The daily box presents an easy way to trade daily buy and sell breakout signals.
A buy breakout signal occurs when the current price rises above the previous day high price.
A sell breakout signal occurs when the current price falls below the previous day low price.
The indicator draws 3 different types of colored boxes:
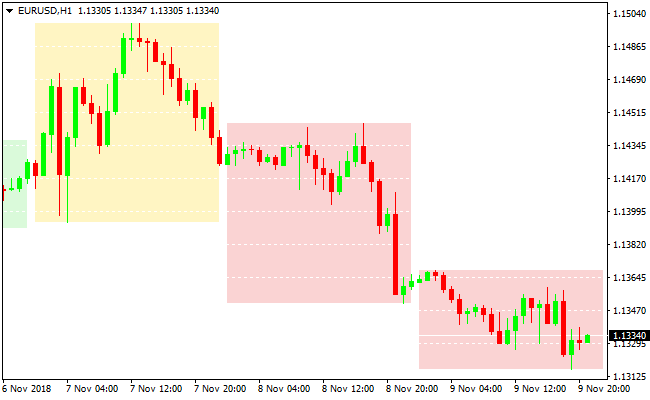
- Green box: the close price is higher that the open price (bullish)
- Red box: the close price is lower than the open price (bearish)
- Yellow box: this box has a Doji single chart pattern inside. This could indicate a possible trend reversal.
Free Download
Download the “gg-timebox-indicator.mq4” MT4 indicator
Example Chart
The EUR/USD 1-hour chart below displays the Timebox Breakout Metatrader 4 indicator in action.

Basic Trading Signals
Signals from the Timebox Breakout MT4 indicator are easy to interpret and goes as follows:
Buy Signal: Open buy position when price breaks above the high of the previous day box high price. Place a protective stop-loss below short-term support.
Sell Signal: Open short position when price falls below the low of the previous day box low price. Place a protective stop-loss above short-term resistance.
Trade Exit : Use your own method of trade exit.
Download
Download the “gg-timebox-indicator.mq4” Metatrader 4 indicator
MT4 Indicator Characteristics
Currency pairs: Any
Platform: Metatrader 4
Type: Chart pattern indicator
Customization options: Variable (custom time frame, unit to process) Colors, width & Style.
Time frames: 1-Minute, 5-Minutes, 15-Minutes, 30-Minutes, 1-Hour, 4-Hours, 1-Day, 1-Week, 1-Month
Type: breakout
Installation
Copy and paste the gg-timebox-indicator.mq4 into the MQL4 indicators folder of the Metatrader 4 trading platform.
You can access this folder from the top menu as follows:
File > Open Data Folder > MQL4 > Indicators (paste here)