
The Synthetic RSI Forex Signal indicator for Metatrader 5 is composed of 3 Relative Strength Index indicators and 3 exponential moving averages and generates relatively few false signals.
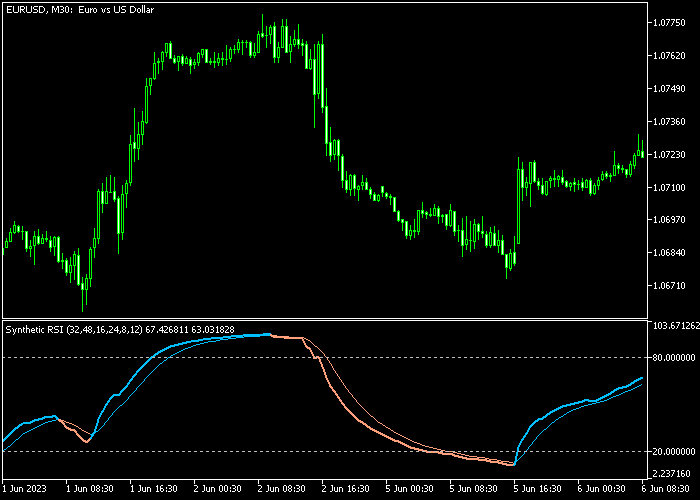
The Synthetic RSI appears in an indicator window as a blue and brown colored non-repaint signal line.
How to spot the trend with it?
- The blue line signals a bull trend.
- The brown line signals a bear trend.
The following indicator inputs and parameters can be modified: EMA period 1, RSI period 1, EMA period 2, RSO period 2, EMA period 3, RSI period 3, price, signal period.
The Synthetic RSI Forex Signal indicator works for any trading instrument (Forex, Stocks, Indices, etc.).
Please make yourself familiar with this technical indicator and test it first on a demo account until you fully understand how it works.
It supports all time frames and Forex pairs.
Download Indicator 🆓
Synthetic RSI.mq5 Indicator (MT5)
Chart Example
The following chart shows how the Synthetic RSI Forex Signal indicator looks like when applied to the MT5 chart.
How To Buy And Sell FX Pairs With The Synthetic RSI Forex Signal Indicator?
Find a simple trading example below:
Buy Signal
- A buy signal is formed when the blue colored Synthetic RSI line gets printed on the chart.
- Open a buy trade and place your protective stop loss below the previous swing low price.
- Exit the buy trade for a fixed take profit of hold the trade until a sell signal gets displayed on the chart.
Sell Signal
- A sell signal is formed when the brown colored Synthetic RSI line gets printed on the chart.
- Open a sell trade and place your protective stop loss above the previous swing high price.
- Exit the sell trade for a fixed take profit of hold the trade until a buy signal gets displayed on the chart.
Download Now 🆓
Synthetic RSI.mq5 Indicator (MT5)
Frequently Asked Questions
How Do I Install This Custom Indicator On Metatrader 5?
- Open the MT5 trading platform
- Click on the File menu button located at the top left part of the platform
- Click on Open Data Folder > MQL5 folder > Indicators
- Copy the Synthetic RSI.mq5 indicator file in the Indicators folder
- Close and restart the trading platform
- You will find the indicator here (Navigator window > Indicators)
- Drag the indicator to the chart to get started with it!
How Do I Edit This Indicator?
- Click in the open chart with your right mouse button
- In the dropdown menu, click on Indicator List
- Select the indicator and click on properties
- Now you can edit the inputs, colors, levels, scale and visualization
- Finally click the OK button to save the new configuration