
The Solar Winds indicator for Metatrader 5 is a popular buy/sell technical tool that works best for scalpers and day traders.
How to spot a new trading signal with this indicator?
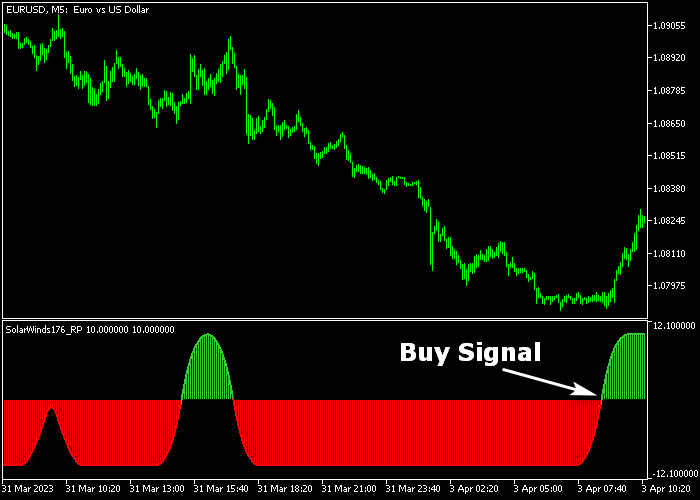
- The green Solar Winds histogram is a buy signal.
- The red Solar Winds histogram is a sell signal.
The indicator does not repaint and works equally well for newbies and seasoned traders alike.
It delivers the best signals during the London and American trading sessions.
The indicator contains the following inputs and parameters: non-repainting, use custom events, period, smooth, do alert, alert mail, colors, and histogram.
First, familiarize yourself with this technical indicator and test it on a demo account.
It supports all time frames and Forex pairs.
Download Indicator 🆓
Solar Winds.mq5 Indicator (MT5)
Chart Example
The following chart shows how the Solar Winds indicator looks when applied to the MT5 chart.
How To Buy And Sell Forex Pairs With The Solar Winds Forex Indicator?
Find a simple trading example below:
Buy Signal
- The start of the green Solar Winds histogram is bullish.
- Open a buy transaction and place your stop loss below the most recent support zone.
- Close the buy trade for a fixed take profit target, or wait for a sell signal.
Sell Signal
- The start of the red Solar Winds histogram is bearish.
- Open a sell transaction and place your stop loss above the most recent resistance zone.
- Close the sell trade for a fixed take profit target, or wait for a buy signal.
Download Now 🆓
Solar Winds.mq5 Indicator (MT5)
Frequently Asked Questions
How Do I Install This Custom Indicator On Metatrader 5?
- Open the MT5 trading platform
- Click on the File menu button located at the top left part of the platform
- Click on Open Data Folder > MQL5 folder > Indicators
- Copy the Solar Winds.mq5 indicator file in the Indicators folder
- Close and restart the trading platform
- You will find the indicator here (Navigator window > Indicators)
- Drag the indicator to the chart to get started with it!
How Do I Edit This Indicator?
- Click in the open chart with your right mouse button
- In the dropdown menu, click on Indicator List
- Select the indicator and click on properties
- Now you can edit the inputs, colors, levels, scale and visualization
- Finally click the OK button to save the new configuration