
The Slow Volume Strength Index oscillator for Metatrader 5 deploys an EMA + volume to identify overbought and oversold market conditions.
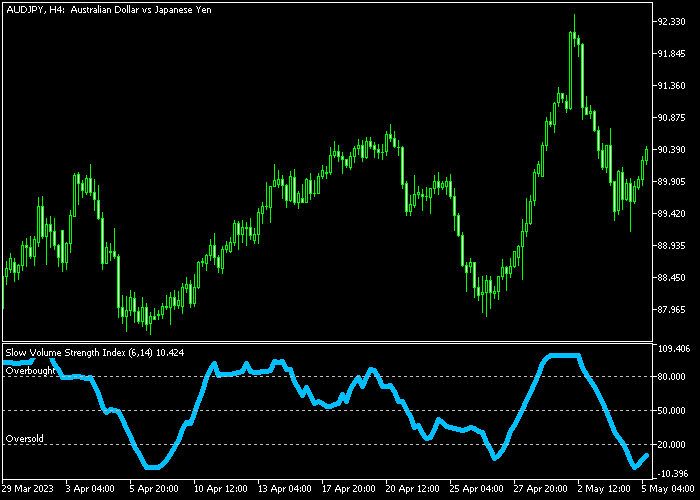
The indicator appears in a separate chart window as a blue-colored signal line that oscillates between overbought and oversold market levels.
- The market is overbought when it reaches the 80.0 level.
- The market is oversold when it reaches the 20.0 level.
It’s recommended to combine the Slow Volume Strength Index Oscillator with a trend trading indicator.
The indicator contains the following inputs and parameters: EMA period, smoothing, overbought, middle, and oversold.
Make yourself familiar with this technical indicator and test it first on a demo account.
It supports all time frames and Forex pairs.
Download Indicator 🆓
Chart Example
The following chart shows what the Slow Volume Strength Index Oscillator looks like when applied to the MT5 chart.
How To Buy And Sell Forex Pairs With The Slow Volume Strength Index Oscillator?
Find a simple trading example below:
Buy Signal
- A buy signal occurs when the blue line turns back above 20.0 from below and the general market trend is up.
- Open a buy transaction and place your stop loss 3 pips below the most recent support area.
- Close the buy trade as soon as the indicator reaches the 80.0 overbought market level.
Sell Signal
- A sell signal occurs when the blue line turns back below 80.0 from above and the general market trend is down.
- Open a sell transaction and place your stop loss 3 pips above the most recent resistance area.
- Close the sell trade as soon as the indicator reaches the 20.0 oversold market level.
Download Now 🆓
Frequently Asked Questions
How Do I Install This Custom Indicator On Metatrader 5?
- Open the MT5 trading platform
- Click on the File menu button located at the top left part of the platform
- Click on Open Data Folder > MQL5 folder > Indicators
- Copy the SVSI.mq5 indicator file in the Indicators folder
- Close and restart the trading platform
- You will find the indicator here (Navigator window > Indicators)
- Drag the indicator to the chart to get started with it!
How Do I Edit This Indicator?
- Click in the open chart with your right mouse button
- In the dropdown menu, click on Indicator List
- Select the indicator and click on properties
- Now you can edit the inputs, colors, levels, scale and visualization
- Finally click the OK button to save the new configuration