
The RSI vs Bollinger Bands forex MT4 indicator is an buy/sell arrows indicator based on BB and RSI.
The indicator tracks channel breakouts with the help of the RSI indicator and then draws buy and sell signals directly on the chart.
The indicator has a lot of options for customization.
Scalpers, day traders, swing traders and position traders can benefit from this indicator.
Free Download
Download the “RSI_vs_BB.mq4” MT4 indicator
Example Chart
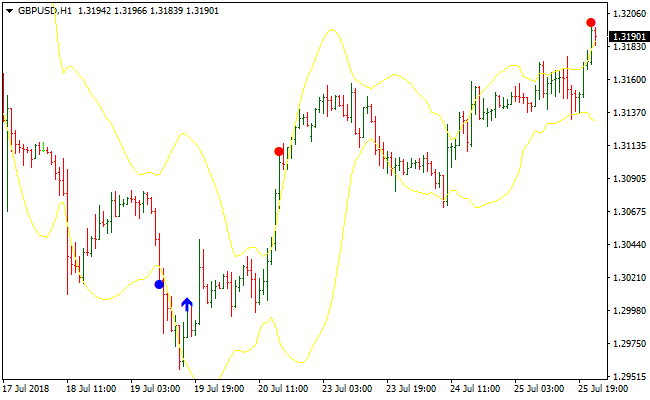
The GBP/USD H1 chart below displays the RSI vs Bollinger Bands forex indicator in action.
Basic Trading Signals
Trading signals from this indicator are simple to interpret and goes a follows:
Buy Trade: Open buy trade when the indicator displays a blue arrow
Sell Trade: Open sell trade when the indicator displays a red arrow
Download
Download the “RSI_vs_BB.mq4” Metatrader 4 indicator
MT4 Indicator Characteristics
Currency pairs: Any
Platform: Metatrader 4
Type: chart pattern indicator
Customization options: Variable (RSI Period, RSI Up Level, RSI Down Level, BB Period, BB Deviation, alerts) Colors, width & Style.
Time frames: 1-Minute, 5-Minutes, 15-Minutes, 30-Minutes, 1-Hour, 4-Hours, 1-Day, 1-Week, 1-Month
Type: Semaphore
Installation
Copy and paste the RSI_vs_BB.mq4 indicator into the MQL4 indicators folder of the Metatrader 4 trading platform.
You can access this folder from the top menu as follows:
File > Open Data Folder > MQL4 > Indicators (paste here)