The RSI (Relative Strength Index) forex MT4 indicator is a very popular indicator used for currency trading that was originally developed by J. Welles Wilder.
RSI is used in a lot of forex strategies and systems to scan and display oversold and overbought market conditions.
The RSI oscillator oscillates between 0 and 100.
The 0 value is considered to be extremely oversold and the 100 value extremely overbought.
Use this indicator together with a trend-following indicator such as moving average, ADMI, Bollinger Bands,… for more reliable forex trading signals.
This indicator is useful for scalpers, day traders, swing traders and position traders on any currency pair.
Free Download
Download the “RSI.mq4” MT4 indicator
Example Chart
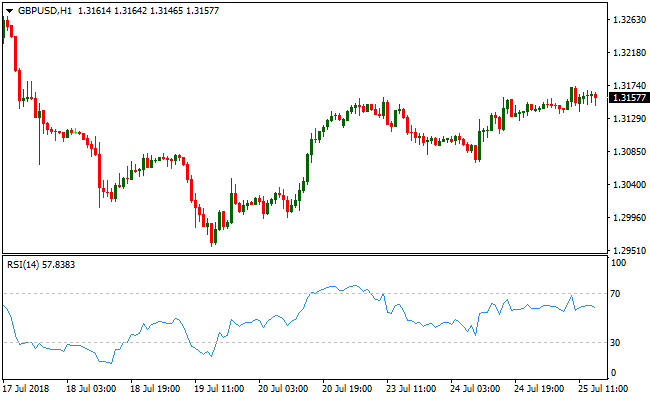
The GBP/USD H1 chart below displays the RSI forex indicator in action.
Basic Trading Signals
Trading signals from the RSI indicator are simple to interpret and goes a follows:
Buy Trade: RSI falls below 30 and then rises above
Sell Trade: RSI rises above 70 and then falls below
Tip: Add a longer period moving average (SMA or EMA type) to the trading chart and trade in the overall direction of the trend indicated by the moving average.
Trend up? Only trade RSI buy signals and avoid its sell signals
Trend down? Only trade RSI sell signals and avoid its buy signals
Download
Download the “RSI.mq4” Metatrader 4 indicator
MT4 Indicator Characteristics
Currency pairs: Any
Platform: Metatrader 4
Type: chart pattern indicator
Customization options: Variable (RSI Period) Colors, width & Style.
Time frames: 1-Minute, 5-Minutes, 15-Minutes, 30-Minutes, 1-Hour, 4-Hours, 1-Day, 1-Week, 1-Month
Type: Oscillator
Installation
Copy and paste the RSI.mq4 indicator into the MQL4 indicators folder of the Metatrader 4 trading platform.
You can access this folder from the top menu as follows:
File > Open Data Folder > MQL4 > Indicators (paste here)


