The RSI Bars Forex scalper developed indicator for Metatrader 5 offers profitable buy and sell signals suitable for both scalpers and day traders.
This indicator is designed to perform well across various time frames, including 1-minute, 5-minute, and 15-minute charts.
It generates buy and sell bars based on RSI levels indicating overbought and oversold market conditions.
Our objective is to achieve a profit range of 6 to 20 pips per trade.
Here’s how the indicator works:
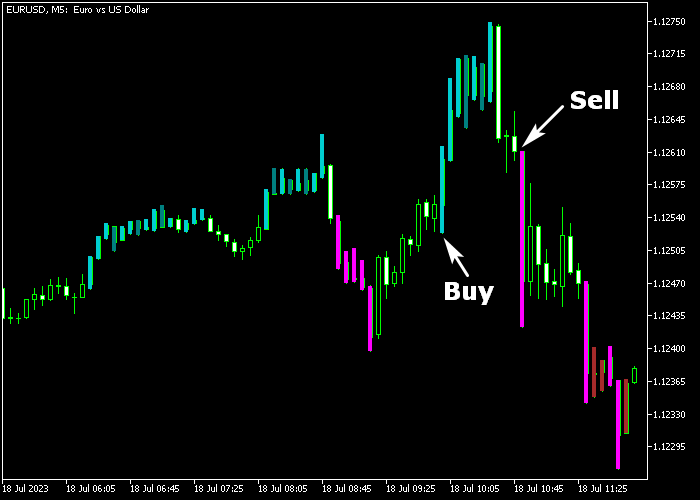
- A sea-green RSI bar represents a buy trade opportunity.
- A magenta RSI bar represents a sell trade opportunity.
The indicator includes several inputs and parameters, such as RSI period, price, overbought level, oversold level, and more.
We recommend gaining confidence in the RSI Bars Forex scalper indicator by testing it extensively on a demo account before using it with real funds.
To optimize your Forex scalping results, consider the following trading tips:
- Apply the RSI Bars scalper indicator to currency pairs with lower spreads.
- Focus on trading during the London and New York trading sessions.
Download Indicator 🆓
Chart Example
The picture below illustrates how the RSI Bars scalper indicator looks like when applied to the MT5 chart.
How To Buy And Sell Currency Pairs Using The RSI Bars Scalper Indicator?
Find a simple trading strategy below:
Buy Signal
- A sea-green colored RSI bar indicates a buy trade entry signal.
- Initiate a buy market order and place your stop slightly below short-term support.
- Close the buy transaction for 6-20 pips profit.
- Optional: await a sell signal to close the buy trade.
Sell Signal
- A magenta colored RSI bar indicates a sell trade entry signal.
- Open a sell market order and place your stop slightly above short-term resistance.
- Close the sell transaction for 6-20 pips profit.
- Optional: await a buy signal to close the buy trade.
Download Now 🆓
Frequently Asked Questions
How Do I Install This Custom Indicator On Metatrader 5?
- Open the MT5 trading platform
- Click on the File menu button located at the top left part of the platform
- Click on Open Data Folder > MQL5 folder > Indicators
- Copy the rsi_bars.mq5 indicator file in the Indicators folder
- Close and restart the trading platform
- You will find the indicator here (Navigator window > Indicators)
- Drag the indicator to the chart to get started with it!
How Do I Edit This Indicator?
- Click in the open chart with your right mouse button
- In the dropdown menu, click on Indicator List
- Select the indicator and click on properties
- Now you can edit the inputs, colors, levels, scale and visualization
- Finally click the OK button to save the new configuration


