
The Renko Trend indicator for Metatrader 5 delivers buy and sell signals based on the famous Renko brick trading methodology.
The indicator analyses price action and transforms the technical data into a simple-to-use Renko bricks trading strategy.
How to interpret the Renko Trend Forex indicator?
- Blue colored Renko bricks suggest a bullish trend.
- Red colored Renko bricks suggest a bearish trend.
The following indicator inputs and parameters can be adjusted: size, and colors.
The Renko Trend indicator should work for any trading instrument that can be loaded in the Metatrader 5 platform.
Make yourself familiar with the Renko Trend indicator and test it first on a practice account for an extended period.
It supports all time frames and Forex pairs.
Download Indicator 🆓
Renko Level.mq5 Indicator (MT5)
Chart Example
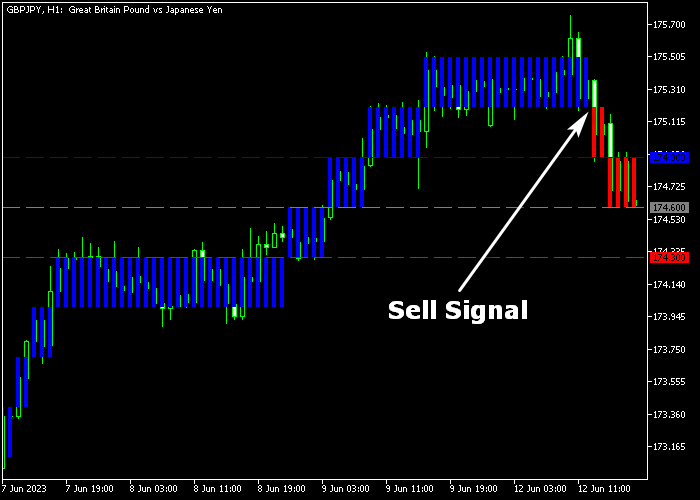
The following chart shows how the Renko Trend indicator looks when applied to the MT5 chart.
How To Buy And Sell FX Pairs With The Renko Trend Indicator?
Find a simple trading example below:
Buy Signal
- A buy signal is given when the first blue colored Renko brick appears on the price chart.
- Initiate a buy transaction and place a protective stop loss below the most recent support region.
- Exit the long trade for a fixed profit target, or wait for the first red colored Renko brick.
Sell Signal
- A sell signal is given when the first red colored Renko brick appears on the price chart.
- Initiate a sell transaction and place a protective stop loss above the most recent resistance region.
- Exit the short trade for a fixed profit target, or wait for the first blue colored Renko brick.
Download Now 🆓
Renko Level.mq5 Indicator (MT5)
Frequently Asked Questions
How Do I Install This Custom Indicator On Metatrader 5?
- Open the MT5 trading platform
- Click on the File menu button located at the top left part of the platform
- Click on Open Data Folder > MQL5 folder > Indicators
- Copy the Renko Level.mq5 indicator file in the Indicators folder
- Close and restart the trading platform
- You will find the indicator here (Navigator window > Indicators)
- Drag the indicator to the chart to get started with it!
How Do I Edit This Indicator?
- Click in the open chart with your right mouse button
- In the dropdown menu, click on Indicator List
- Select the indicator and click on properties
- Now you can edit the inputs, colors, levels, scale and visualization
- Finally click the OK button to save the new configuration