
The Relative Strength Oscillator (RSO) for Metatrader 5 identifies short-term buying and selling trade opportunities that work for scalpers and day traders.
We are looking for 8-20 pips profit per transaction.
The indicator is displayed in a bottom chart window as colored histogram bars that appear above and below 0.
How to interpret this technical tool?
- RSO histogram bars above 0 are bullish.
- RSO histogram bars below 0 are bearish.
The following indicator inputs and parameters can be modified: RSO period.
Tip: Deploy the RSO technical oscillator on the lower spread currency pairs (EUR/USD, GBP/USD, USD/JPY, etc.) for best trading results.
Please make yourself familiar with this technical indicator and test it first on a practice account for an extended period.
Download Indicator 🆓
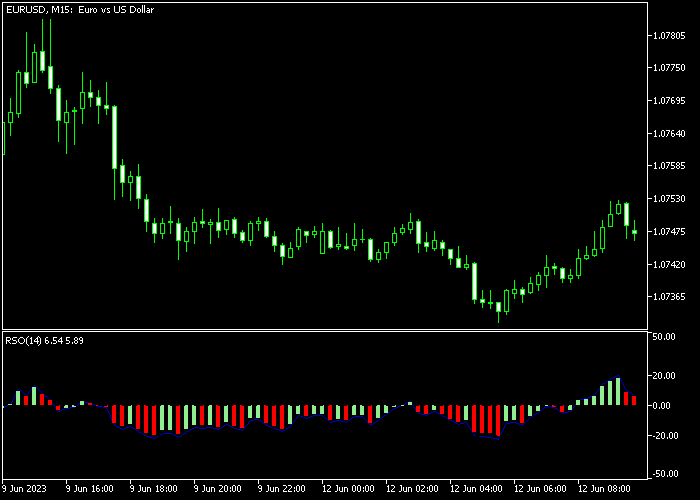
Chart Example
The following chart shows what the Relative Strength Oscillator looks like when applied to the MT5 chart.
How To Buy And Sell Currency Pairs With The Relative Strength Oscillator?
Find a simple trading example below:
Buy Signal
- A buy signal is formed when the RSO oscillator crosses back above the zero level.
- Initiate a buy transaction and set a protective stop loss below short-term support.
- Exit the long trade for 8-20 pips profit target, or wait for a sell signal.
Sell Signal
- A sell signal is formed when the RSO oscillator crosses back below the zero level.
- Initiate a sell transaction and set a protective stop loss above short-term resistance.
- Exit the short trade for 8-20 pips profit target, or wait for a buy signal.
Download Now 🆓
Frequently Asked Questions
How Do I Install This Custom Indicator On Metatrader 5?
- Open the MT5 trading platform
- Click on the File menu button located at the top left part of the platform
- Click on Open Data Folder > MQL5 folder > Indicators
- Copy the RSO.mq5 indicator file in the Indicators folder
- Close and restart the trading platform
- You will find the indicator here (Navigator window > Indicators)
- Drag the indicator to the chart to get started with it!
How Do I Edit This Indicator?
- Click in the open chart with your right mouse button
- In the dropdown menu, click on Indicator List
- Select the indicator and click on properties
- Now you can edit the inputs, colors, levels, scale and visualization
- Finally click the OK button to save the new configuration