
The Recursive Median Signal Oscillator (RMO) indicator for Metatrader 5 is beginner-friendly and can be used for both trade entry and exit signals.
The indicator appears in a separate chart window as a colored green and red line.
How to interpret this indicator?
- The trend is upward when the green signal line appears on the chart.
- The trend is downward when the red signal line appears on the chart.
The following indicator inputs and parameters can be modified: low pass period, high pass period, median period, price, and color change mode.
The RMO indicator works for any trading instrument that can be loaded in the Metatrader 5 platform.
First, familiarize yourself with this technical indicator and test it on a demo account.
It supports all time frames and Forex pairs.
Download Indicator 🆓
Chart Example
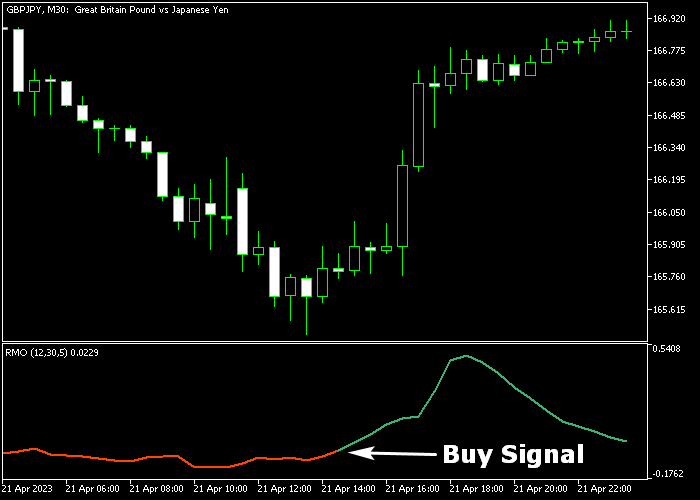
The following chart shows what the Recursive Median Signal Oscillator indicator looks like when applied to the MT5 chart.
How To Buy And Sell Forex Pairs With The RMO Forex Signal Indicator?
Find a simple trading example below:
Buy Signal
- The start of the green RMO line is a buy trade entry signal.
- Open a buy trade and place your stop loss 3 pips below the most recent support area.
- Close the buy trade for a reward to risk ratio of at least 1.5, or better.
Sell Signal
- The start of the red RMO line is a sell trade entry signal.
- Open a sell trade and place your stop loss 3 pips above the most recent resistance area.
- Close the sell trade for a reward to risk ratio of at least 1.5, or better.
Download Now 🆓
Frequently Asked Questions
How Do I Install This Custom Indicator On Metatrader 5?
- Open the MT5 trading platform
- Click on the File menu button located at the top left part of the platform
- Click on Open Data Folder > MQL5 folder > Indicators
- Copy the RMO.mq5 indicator file in the Indicators folder
- Close and restart the trading platform
- You will find the indicator here (Navigator window > Indicators)
- Drag the indicator to the chart to get started with it!
How Do I Edit This Indicator?
- Click in the open chart with your right mouse button
- In the dropdown menu, click on Indicator List
- Select the indicator and click on properties
- Now you can edit the inputs, colors, levels, scale and visualization
- Finally click the OK button to save the new configuration