The Rainbow Trend Oscillator for Metatrader 5 is a powerful trend trading indicator that can deliver winning signals almost every day.
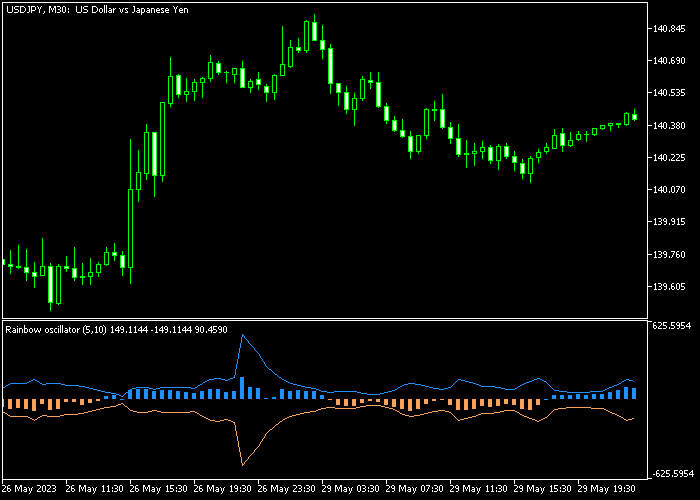
The trading signals appear in a sub-chart window as a series of blue and brown colored trend bars.
Essentially, the blue colored bars are bullish while the brown colored bars are bearish.
The following indicator inputs and parameters can be modified: period, RWMA depth, and price (median).
For M1 and M5 chart traders: deploy the indicator on the lower spread Forex pairs for better and faster profits.
Please make yourself familiar with this technical indicator and test it first on a demo account before using it on real trading account.
Download Indicator 🆓
Ranbow oscillator.mq5 Indicator (MT5)
Chart Example
The following chart shows what the Rainbow Trend Oscillator indicator looks like when applied to the MT5 chart.

How To Buy And Sell Currency Pairs With The Rainbow Trend Oscillator?
Find a simple trading example below:
Buy Signal
- The appearance of the first blue colored rainbow bar is a buy trade entry signal.
- Open a buy order and place a stop loss slightly below the previous swing low level.
- Exit the buy trade for a fixed profit target, or wait for the first brown colored bar.
Sell Signal
- The appearance of the first brown colored rainbow bar is a sell trade entry signal.
- Open a sell order and place a stop loss slightly above the previous swing high level.
- Exit the sell trade for a fixed profit target, or wait for the first blue colored bar.
Download Now 🆓
Ranbow oscillator.mq5 Indicator (MT5)
Frequently Asked Questions
How Do I Install This Custom Indicator On Metatrader 5?
- Open the MT5 trading platform
- Click on the File menu button located at the top left part of the platform
- Click on Open Data Folder > MQL5 folder > Indicators
- Copy the Ranbow oscillator.mq5 indicator file in the Indicators folder
- Close and restart the trading platform
- You will find the indicator here (Navigator window > Indicators)
- Drag the indicator to the chart to get started with it!
How Do I Edit This Indicator?
- Click in the open chart with your right mouse button
- In the dropdown menu, click on Indicator List
- Select the indicator and click on properties
- Now you can edit the inputs, colors, levels, scale and visualization
- Finally click the OK button to save the new configuration