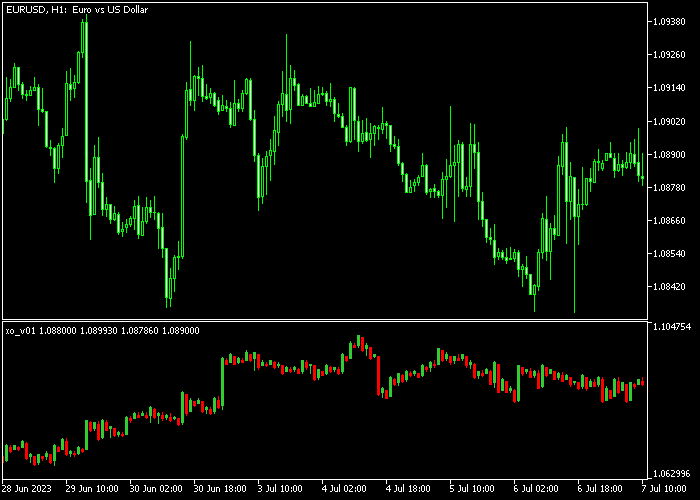
The Point and Figure indicator designed for Metatrader 5 creates a visual representation of a point and figure chart in a dedicated window.
The Point and Figure chart is displayed as a series of green and red colored candles.
Why use Point and Figure trading charts?
Point and figure charts are unique as they exclude the time element and focus solely on the upward and downward movements of the price.
These charts do not display sideways price action, offering a simplified perspective on price trends.
To enhance the accuracy of trade entry and exit signals, it is advisable to combine Point and Figure charts with additional trading indicators.
The indicator inputs and variables that can be adjusted include the following: price step, the threshold for determining a change in direction, and the number of bars used for verification.
Familiarize yourself with the Point and Figure indicator and conduct thorough testing on a demo account before trading live with it.
Download Indicator 🆓
Chart Example
The picture below shows how the Point and Figure indicator looks like when applied to the MT5 chart.

Download Now 🆓
Frequently Asked Questions
How Do I Install This Custom Indicator On Metatrader 5?
- Open the MT5 trading platform
- Click on the File menu button located at the top left part of the platform
- Click on Open Data Folder > MQL5 folder > Indicators
- Copy the xo_v01.mq5 indicator file in the Indicators folder
- Close and restart the trading platform
- You will find the indicator here (Navigator window > Indicators)
- Drag the indicator to the chart to get started with it!
How Do I Edit This Indicator?
- Click in the open chart with your right mouse button
- In the dropdown menu, click on Indicator List
- Select the indicator and click on properties
- Now you can edit the inputs, colors, levels, scale and visualization
- Finally click the OK button to save the new configuration