
About the Parabolic SAR Indicator
The Parabolic SAR indicator for MT4 is a widely used trend-following tool designed to highlight potential entry and exit points in the market.
“SAR” stands for Stop and Reverse, reflecting the indicator’s ability to signal trend shifts.
It plots a series of colored dots above or below the price.
Dots below the price indicate bullish momentum, suggesting buy opportunities, while dots above the price indicate bearish momentum, signaling sell opportunities.
Although effective as a standalone tool, combining Parabolic SAR with other indicators, such as moving averages, can improve trade accuracy.
For example, aligning trades with a 200-period moving average ensures entries follow the dominant trend.
This indicator is flexible and works across all currency pairs and timeframes.
Traders can use it for scalping, day trading, or short-term swing trading while following clear trend-based signals.
Free Download
Download the “Parabolic.mq4” MT4 indicator
Key Features
- Displays dynamic buy and sell signals with dots above or below price.
- Helps identify potential trend reversals quickly.
- Integrates easily with moving averages or other trend filters.
- Suitable for scalping, day trading, and short-term swing trading.
- Works on any currency pair and timeframe.
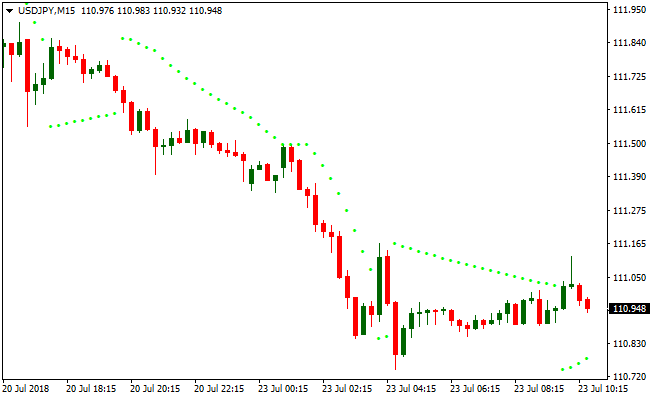
Indicator Chart
The Parabolic SAR indicator appears beneath the main price area as a series of colored dots positioned above or below price movements.
Buy dots appear under bullish candles, and sell dots appear above bearish candles, providing clear trend direction and potential entry points.
Guide to Trade with Parabolic SAR Indicator
Buy Rules
- Wait for Parabolic SAR dots to appear below the price.
- Confirm the overall trend with a higher timeframe or moving average.
- Enter a buy trade when momentum aligns with bullish signals.
- Avoid trades against a dominant downtrend.
Sell Rules
- Wait for Parabolic SAR dots to appear above the price.
- Confirm the overall trend with a higher timeframe or moving average.
- Enter a sell trade when momentum aligns with bearish signals.
- Avoid trades against a dominant uptrend.
Stop Loss
- Place the stop just beyond the recent Parabolic SAR dots for buy trades.
- Place the stop just beyond the recent Parabolic SAR dots for sell trades.
Take Profit
- Close buy trades when dots flip above the price.
- Close sell trades when dots flip below the price.
- Consider partial exits near significant support or resistance.
- Let strong trends run if the dots continue to confirm momentum.
Parabolic SAR and Lucky Reversal Indicator Forex Trend Reversal Strategy
This MT4 trend reversal strategy combines the Parabolic SAR indicator with the Lucky Reversal indicator to catch early trend changes on M5, M15, and H1 timeframes.
The Parabolic SAR provides short-term direction by showing dots below the price for bullish bias and above the price for bearish bias.
The Lucky Reversal indicator adds reversal confirmation with blue arrows for bullish reversal signals and red arrows for bearish reversal signals.
This strategy works by waiting for both indicators to align before taking a trade.
When the Parabolic SAR indicates a shift in short-term direction and the Lucky Reversal arrow appears at a key point, the setup gains strength.
These confirmations help reduce random signals that can occur on lower timeframes.
The strategy can be applied to major and minor forex pairs that show reliable price swings on M5, M15 and H1 charts.
It can capture both intraday pullbacks and the start of larger swings when momentum shifts.
The combination of trend change and reversal signal increases the probability of entering near the early part of a new move.
Buy Entry Rules
- Wait for the Parabolic SAR dots to flip from above to below the price, indicating a short-term bullish shift.
- Look for a blue arrow from the Lucky Reversal indicator showing a bullish reversal signal.
- Enter a buy trade at the close of the candle where both the SAR flip and the blue arrow appear.
- Place the stop loss a few pips below the recent swing low or the Parabolic SAR dot below the price.
- Manage the trade by moving the stop to breakeven once price moves in your favor by a reasonable amount for the timeframe.
- Exit the trade when the Parabolic SAR dots flip back above price or when a red arrow appears from the Lucky Reversal indicator.
Sell Entry Rules
- Wait for the Parabolic SAR dots to flip from below to above the price, indicating a short-term bearish shift.
- Look for a red arrow from the Lucky Reversal indicator showing a bearish reversal signal.
- Enter a sell trade at the close of the candle where both the SAR flip and red arrow appear.
- Place the stop loss a few pips above the recent swing high or the Parabolic SAR dot above the price.
- Manage the trade by moving the stop to breakeven once price moves in your favor by a reasonable amount for the timeframe.
- Exit the trade when the Parabolic SAR dots flip below price or when a blue arrow appears from the Lucky Reversal indicator.
Advantages
- Catches potential trend reversals early by combining two complementary signals.
- Visual technical indicators make entries and exits easier to spot on fast timeframes.
- Works across multiple timeframes from M5 to H1, giving flexibility to different trading styles.
- Stop losses are based on logical price levels, not arbitrary pip values.
- Helps reduce entries during sideways markets since both indicators must agree.
Drawbacks
- On lower timeframes, there can still be noise and false signals, requiring discipline.
- Strong trends can whip you out prematurely when short-term reversal signals occur within the main move.
- Requires traders to manage trades actively with exits based on indicator changes.
- Less effective in choppy markets where price moves sideways without clear swings.
Example Case Study 1
On the M15 EURJPY chart during a reversal from a short downtrend, the Parabolic SAR dots flipped from above to below the price.
Shortly after, a blue arrow appeared from the Lucky Reversal indicator at a support pivot.
A buy trade was entered at candle close.
The stop loss was placed just below the recent swing low.
Price rallied strongly over the next few bars, and the trade was exited when the Parabolic SAR dots flipped back above price.
This setup captured a 35 pip move.
Example Case Study 2
On the H1 GBPUSD chart after a sustained uptrend, the Parabolic SAR dots shifted from below to above the price, indicating bearish pressure.
A red arrow from the Lucky Reversal indicator appeared near a recent resistance level confirming a reversal.
A sell trade was entered at candle close, with the stop loss placed above the recent high.
Price continued lower over the next several hours, and the trade was exited when a blue arrow appeared signaling a bullish reversal.
This H1 setup yielded an 86 pip reversal move.
Strategy Tips
- Favor setups where the reversal arrow appears near a recent swing high or swing low for better context.
- Avoid trading immediately after major economic news releases, as volatility can trigger false signals.
- Check the higher timeframe trend; trading with the H1 trend on M5 and M15 increases the probability of success.
- Do not ignore clear indicator signals, even if the price seems extended; early reversals can form quickly.
- Use the Parabolic SAR flip as both an entry confirmation and an exit cue to protect profits.
Download Now
Download the “Parabolic.mq4” Metatrader 4 indicator
FAQ
Can Parabolic SAR be used on all timeframes?
Yes. It works on every timeframe, from M1 scalping charts to daily and weekly trading setups.
Should I trade every dot signal?
No. It’s best to trade in the direction of the overall trend or combine signals with moving averages to avoid false entries.
Is Parabolic SAR suitable for range-bound markets?
It performs best in trending markets. In sideways conditions, dot flips may produce false signals and should be filtered with trend confirmation.
Summary
The Parabolic SAR indicator provides clear trend-following signals through dynamic dots that indicate potential entries and exits.
Its simplicity and adaptability make it a reliable tool for traders of all levels.
When combined with trend filters or moving averages, the Parabolic SAR can help traders capture trend momentum efficiently while managing risk and identifying early reversals.


