
As the name suggests, the no-lag MACD indicator for Metatrader 5 is a MACD buy/sell technical tool that doesn’t lag market prices.
This MACD-type indicator works very well for scalpers and day traders.
It consists of colored histogram bars that oscillate above and below the zero level.
How to spot bullish and bearish market trends with this non-lagging indicator?
- MACD bars that appear above the zero level indicate a bullish trend.
- MACD bars that appear below the zero level indicate a bearish trend.
The indicator contains the following inputs and parameters: fast non-lag period, slow non-lag period, signal period, fast non-lag method, slow non-lad method, signal method, applied price, filter, and deviation.
First, familiarize yourself with this technical indicator and test it on a demo account.
It supports all time frames and Forex pairs.
Download Indicator 🆓
NonLag_MACD.mq5 Indicator (MT5)
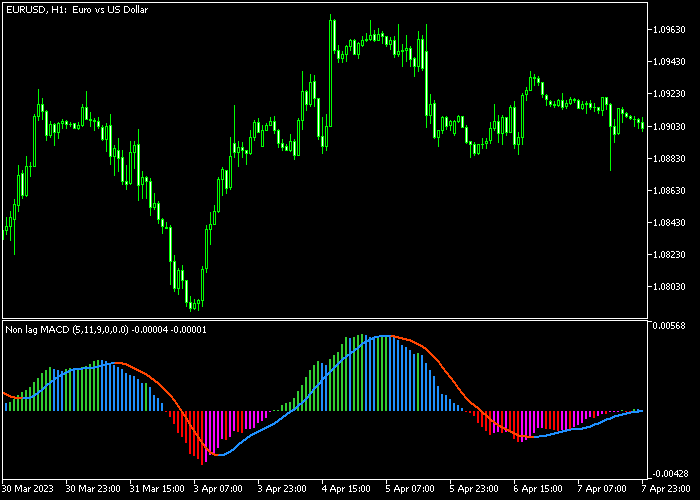
Chart Example
The following chart shows what the No Lag MACD Forex indicator looks like when applied to the MT5 chart.
How To Buy And Sell Forex Pairs With The No Lag MACD Forex Indicator?
Find a simple trading example below:
Buy Signal
- The first green colored no lag MACD bar above the zero level is a buy signal.
- Open a long trade and place your stop loss below immediate support.
- Close the buy trade for 7-20 pips profit.
Sell Signal
- The first red colored no lag MACD bar below the zero level is a sell signal.
- Open a short trade and place your stop loss above immediate resistance.
- Close the sell trade for 7-20 pips profit.
Download Now 🆓
NonLag_MACD.mq5 Indicator (MT5)
Frequently Asked Questions
How Do I Install This Custom Indicator On Metatrader 5?
- Open the MT5 trading platform
- Click on the File menu button located at the top left part of the platform
- Click on Open Data Folder > MQL5 folder > Indicators
- Copy the NonLag_MACD.mq5 indicator file in the Indicators folder
- Close and restart the trading platform
- You will find the indicator here (Navigator window > Indicators)
- Drag the indicator to the chart to get started with it!
How Do I Edit This Indicator?
- Click in the open chart with your right mouse button
- In the dropdown menu, click on Indicator List
- Select the indicator and click on properties
- Now you can edit the inputs, colors, levels, scale and visualization
- Finally click the OK button to save the new configuration