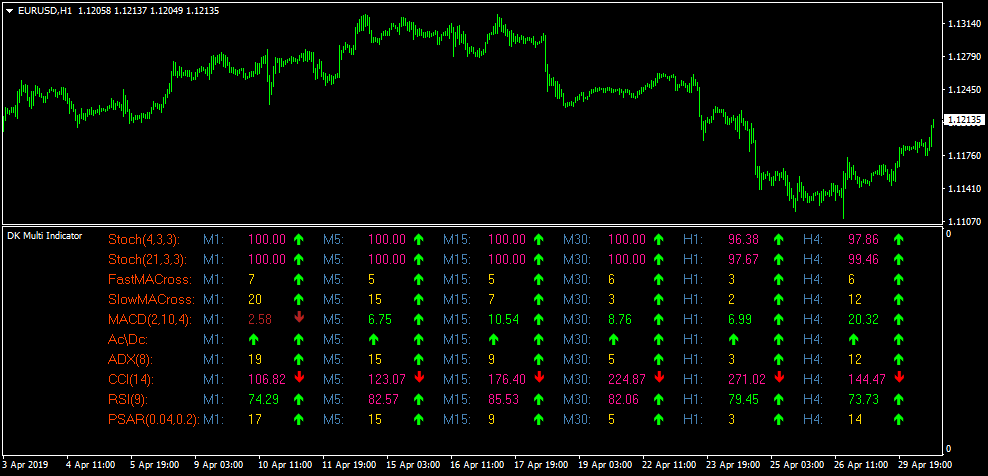
The Multi-Timeframe Trend Dashboard MT4 forex indicator provides detailed trend analysis information for any currency pair on 5 different timeframe’s.
It uses real-time data from the following technical indicators:
Stochastic (4,3,3), Stochastic (21, 3, 3), Fast Moving Average Cross, Slow Moving Average Cross, Ac/Dc, MACD, ADX, CCI, RSI and PSAR.
All forex analysis data combined will give you a clear picture of where the trend is heading to, up or down.
A green UP arrow suggests the trend is positive while a red DOWN arrow indicates the trend is negative.
The multi-timeframe trend dashboard works best when used together with other analysis tools or technical indicators.
Free Download
Download the “DK MultiTimeFrame Indicator.mq4” MT4 indicator
Example Chart
The EUR/USD H1 chart below displays the Multi-Timeframe Trend Dashboard Metatrader 4 forex indicator in action.
Basic Trading Signals
Signals from the Multi-Timeframe Trend Dashboard MT4 forex indicator are easy to interpret and goes as follows:
Buy Signal: Open buy trade when most of the arrows are colored green. This suggests the overall trend is up.
Sell Signal: Open sell trade when most of the arrows are colored red. This suggests the overall trend is down.
Download
Download the “DK MultiTimeFrame Indicator.mq4” Metatrader 4 indicator
MT4 Indicator Characteristics
Currency pairs: Any
Platform: Metatrader 4
Type: chart window indicator
Customization options: Width & Style.
Time frames: 1-Minute, 5-Minutes, 15-Minutes, 30-Minutes, 1-Hour, 4-Hours
Type: signals
Installation
Copy and paste the DK MultiTimeFrame Indicator.mq4 indicator into the MQL4 indicators folder of the Metatrader 4 trading platform.
You can access this folder from the top menu as follows:
File > Open Data Folder > MQL4 > Indicators (paste here)


