
The Multi LSMA Slopes indicator for Metatrader 5 is a non-repaint Forex scalper that delivers accurate short-term entry and exit signals.
It works similarly to the Multi JMA Slopes indicator.
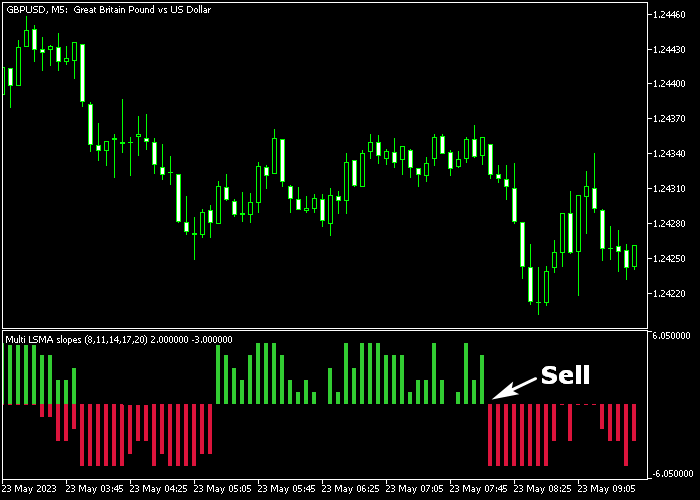
The indicator appears in a bottom chart as green and red colored bars that provide trend direction.
Understanding the Multi LSMA Slopes indicator:
- Green histogram bars represent a bullish market.
- Red histogram bars represent a bearish market.
The following indicator inputs and parameters can be modified: period 1, period 2, period 3, period 4, period 5, price.
The Multi LSMA Slopes indicator should work equally well across all time frames.
Please make yourself familiar with this technical indicator and test it first on a demo account for an extended period.
Download Indicator 🆓
Multi LSMA slopes.mq5 Indicator (MT5)
Chart Example
The following chart shows how the Multi LSMA Slopes indicator looks like when applied to the MT5 chart.
How To Buy And Sell Forex Pairs With The Multi LSMA Slopes Scalper Indicator?
Find a simple trading example below:
Buy Signal
- A buy signal is given as soon as the green colored LSMA slope bar gets displayed in the bottom chart.
- Execute a buy order and place a stop loss slightly below short-term support.
- Exit the buy trade for 6-15 pips profit, or wait for a sell trend reversal signal.
Sell Signal
- A sell signal is given as soon as the red colored LSMA slope bar gets displayed in the bottom chart.
- Execute a sell order and place a stop loss slightly above short-term resistance.
- Exit the sell trade for 6-15 pips profit, or wait for a buy trend reversal signal.
Download Now 🆓
Multi LSMA slopes.mq5 Indicator (MT5)
Frequently Asked Questions
How Do I Install This Custom Indicator On Metatrader 5?
- Open the MT5 trading platform
- Click on the File menu button located at the top left part of the platform
- Click on Open Data Folder > MQL5 folder > Indicators
- Copy the Multi LSMA slopes.mq5 indicator file in the Indicators folder
- Close and restart the trading platform
- You will find the indicator here (Navigator window > Indicators)
- Drag the indicator to the chart to get started with it!
How Do I Edit This Indicator?
- Click in the open chart with your right mouse button
- In the dropdown menu, click on Indicator List
- Select the indicator and click on properties
- Now you can edit the inputs, colors, levels, scale and visualization
- Finally click the OK button to save the new configuration