
The MACD indicator developed for MT5 is widely recognized as one of the most popular technical indicators among financial traders.
In case you don’t know, MACD stands for Moving Average Convergence Divergence.
To achieve optimal trading results, it is recommended to combine this trading tool with a trend indicator.
Let’s explore how the MACD generates market signals:
- MACD bars positioned above the 0 level signal a buy trend.
- MACD bars positioned below the 0 level signal a sell trend.
You can modify various inputs and variables, such as the fast EMA period, slow EMA period, signal SMA period, applied price (close), and colors.
It is essential to familiarize yourself with its functionality and conduct thorough testing on a demo account before applying the MACD indicator to a real account.
Download Indicator 🆓
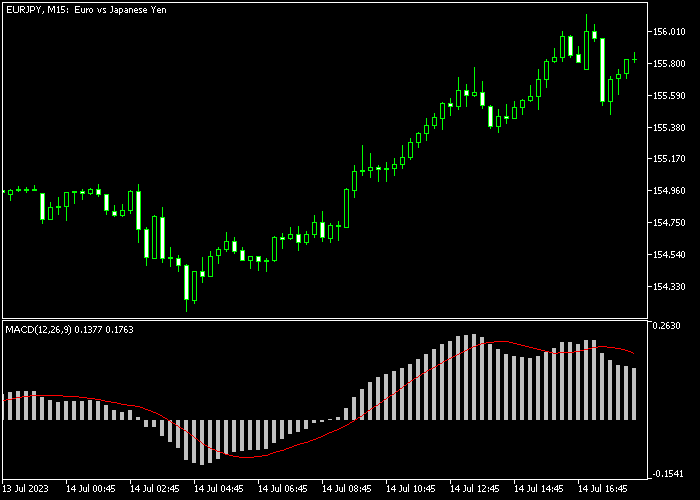
Chart Example
The picture below shows how the MACD indicator looks like when applied to the MT5 chart.
How To Buy And Sell Forex Pairs With The MACD Indicator?
Find a simple trading example below:
Buy Signal
- A buy signal is triggered when the MACD histogram bars cross back above the 0 level from below.
- Open a buy trade and place a stop loss slightly below short-term support.
- Take profit and reverse the buy position when the MACD bars turn back below 0.
Sell Signal
- A sell signal is generated when the MACD histogram bars cross back below the 0 level from above.
- Open a sell trade and place a stop loss slightly above short-term resistance.
- Take profit and reverse the sell position when the MACD bars turn back above 0.
Download Now 🆓
Frequently Asked Questions
How Do I Install This Custom Indicator On Metatrader 5?
- Open the MT5 trading platform
- Click on the File menu button located at the top left part of the platform
- Click on Open Data Folder > MQL5 folder > Indicators
- Copy the macd.mq5 indicator file in the Indicators folder
- Close and restart the trading platform
- You will find the indicator here (Navigator window > Indicators)
- Drag the indicator to the chart to get started with it!
How Do I Edit This Indicator?
- Click in the open chart with your right mouse button
- In the dropdown menu, click on Indicator List
- Select the indicator and click on properties
- Now you can edit the inputs, colors, levels, scale and visualization
- Finally click the OK button to save the new configuration