The MA Trend Bar Forex indicator for Metatrader 5 transforms a moving average into a buy & sell bar indicator that works for any time frame.
The indicator follows the most likely up or down trend and can be used as a standalone technical tool.
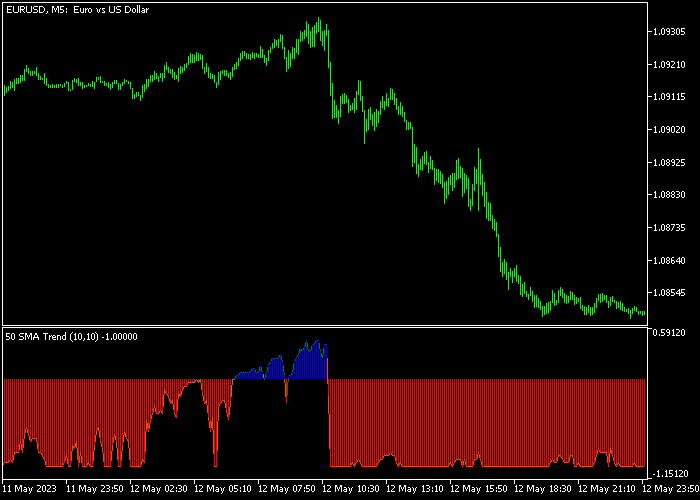
Understanding the colored trend bars:
- A blue colored MA Trend bar is bullish.
- A red colored MA Trend bar is bearish.
The following indicator inputs and parameters can be modified: period begin, period step, count, method, and applied price.
For M1 and M5 chartists: the indicator should deliver the best results in the London and New York trading sessions.
Make yourself familiar with this technical indicator and test it first on a demo account.
Download Indicator 🆓
Chart Example
The following chart shows how the MA Trend Bar indicator looks like when applied to the MT5 chart.

How To Buy And Sell Forex Pairs With The MA Trend Bar Indicator?
Find a simple trading example below:
Buy Signal
- A buy signal is given as soon as the blue colored MA Trend bar shows up in the chart.
- Open a buy trade and set your stop loss slightly below support.
- Close the buy trade for a fixed profit target or hold the trade until the first red MA Trend bar shows up in the chart.
Sell Signal
- A sell signal is given as soon as the red colored MA Trend bar shows up in the chart.
- Open a sell trade and set your stop loss slightly above resistance.
- Close the sell trade for a fixed profit target or hold the trade until the first blue MA Trend bar shows up in the chart.
Download Now 🆓
Frequently Asked Questions
How Do I Install This Custom Indicator On Metatrader 5?
- Open the MT5 trading platform
- Click on the File menu button located at the top left part of the platform
- Click on Open Data Folder > MQL5 folder > Indicators
- Copy the MA_Trend.mq5 indicator file in the Indicators folder
- Close and restart the trading platform
- You will find the indicator here (Navigator window > Indicators)
- Drag the indicator to the chart to get started with it!
How Do I Edit This Indicator?
- Click in the open chart with your right mouse button
- In the dropdown menu, click on Indicator List
- Select the indicator and click on properties
- Now you can edit the inputs, colors, levels, scale and visualization
- Finally click the OK button to save the new configuration