
The MA Plus Forex Signals indicator for Metatrader 5 is a solid buy/sell technical tool based on the well-known Hull moving average.
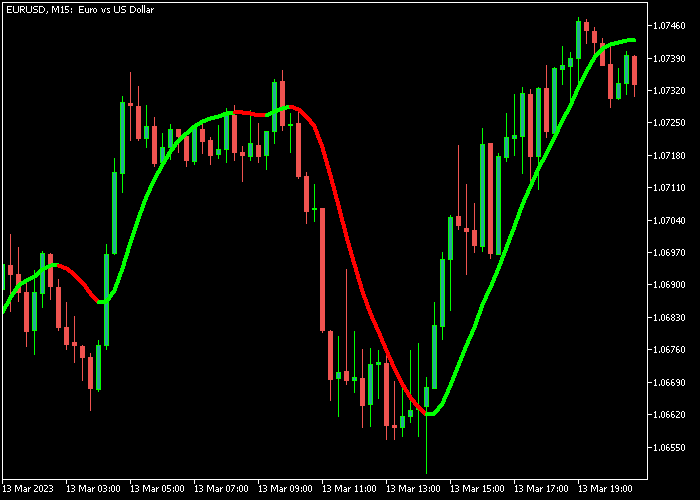
The indicator appears as a bi-colored signal line on the main chart screen.
The rules are very easy to follow and work well for scalpers, day traders, and swing traders.
- A green signal line is bullish.
- A red signal line is bearish.
You can easily use this technical indicator as a trend-confirmation trading tool.
The following indicator inputs can be modified: period, method, applied price, hull method, and virtual bars.
First, familiarize yourself with this technical indicator and test it on a demo account.
It supports all time frames and Forex pairs.
Download Indicator 🆓
Chart Example
The following chart shows what the MA Plus Forex Signals indicator looks like when applied to the MT5 chart.
How To Buy And Sell Forex Pairs With The MA Plus Forex Signals Indicator?
Find a simple trading example below:
Buy Signal
- A bullish signal occurs when the green line starts painting on the chart.
- Open a buy trade and place a stop loss 5 pips below the most recent swing low.
- Close the buy trade as soon as a sell trigger signal occurs on the chart (red line).
Sell Signal
- A bearish signal occurs when the red line starts painting on the chart.
- Open a sell transaction and place a stop loss 5 pips above the most recent swing high.
- Close the sell trade as soon as a buy trigger signal occurs on the chart (green line).
Download Now 🆓
Frequently Asked Questions
How Do I Install This Custom Indicator On Metatrader 5?
- Open the MT5 trading platform
- Click on the File menu button located at the top left part of the platform
- Click on Open Data Folder > MQL5 folder > Indicators
- Copy the MA plus.mq5 indicator file in the Indicators folder
- Close and restart the trading platform
- You will find the indicator here (Navigator window > Indicators)
- Drag the indicator to the chart to get started with it!
How Do I Edit This Indicator?
- Click in the open chart with your right mouse button
- In the dropdown menu, click on Indicator List
- Select the indicator and click on properties
- Now you can edit the inputs, colors, levels, scale and visualization
- Finally click the OK button to save the new configuration