The Knoxville Divergence indicator for mt4 (Metatrader 4) finds counter-trend trades based on positive and negative divergences found between price and Knoxville.
This indicator appears in the main MT4 chart window in the form of green and red divergence lines.
Buy and sell trade example:
- Open a buy trade when the green Knoxville Divergence line appears on the chart.
- Open a sell trade when the red Knoxville Divergence line appears on the chart.
The indicator works on all currency pairs and time frames equally.
Free Download:
Download the “KnoxvilleDivergence.mq4” indicator for MT4
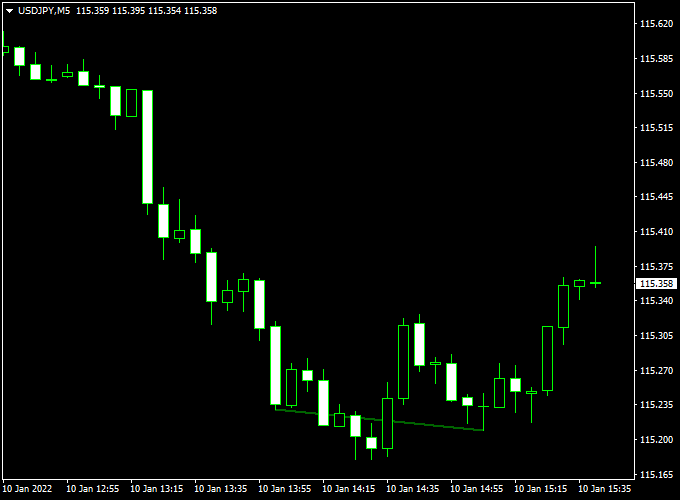
Indicator Example Chart (USD/JPY M5)
The example chart below displays the Knoxville Divergence mt4 indicator in action on the trading chart.

Trading Signals (example):
Utilize your own favorite trade entry, stop loss and take profit method to trade with the Knoxville Divergence indicator.
As always, trade in agreement with the overall trend and practice on a demo account first until you fully understand this indicator.
Indicator Specifications & Inputs:
Trading Platform: Developed for Metatrader 4 (MT4)
Currency pairs: Works for any pair
Time frames: Works for any time frame
Input Parameters: Variable (inputs tab), color settings & style
Indicator type: Divergence
Repaint? No.
Download Now:
Download the “KnoxvilleDivergence.mq4” indicator for Metatrader 4
Usage:
Works for any trade style: scalping, day trading and swing trading.
The Knoxville Divergence indicator was developed for the MT4 trading platform and can be used as a standalone indicator.
Please note that even the best trading indicator cannot yield a 100% win rate over long periods.
Installation:
Open the Metatrader 4 platform
From the top menu, click on “File”
Then click on “Open Data Folder”
Then double click with your mouse button on “MQL4”
Now double click on “Indicators”
Paste the KnoxvilleDivergence.mq4 indicator in the Indicators folder.
Finally restart the MT4 platform and attach the indicator to any chart.
How to remove the indicator?
Click with your right mouse button in the chart with the indicator attached onto it.
Select “Indicator List” from the drop down menu.
Select the indicator and press delete.
How to edit the indicator’s inputs and parameters?
Right click with your mouse button in the chart with the indicator attached onto it.
From the drop down menu, click on indicators list.
Select the indicator from the list and press edit.
Now you can edit the indicator.
Finally, press the OK button to save the updated configuration.