
The Kalman Bands indicator for Metatrader 5 measures market volatility and it can be used for both trade entry and exit signals.
Generally speaking, wide Kalman bands indicate high volatility while narrow bands indicate low volatility.
How to spot market trends with this tool?
- The market trend is up when the Kalman bands are sloping up.
- The market trend is down when the Kalman bands are sloping down.
The indicator allows customizing the following settings and parameters: price, filter order, fast filter period, smoothing period, pre-smoothing MA mode, and multiplier of Sigma.
The indicator works for any trading instrument (Forex, Stocks, Indices, Metals, etc.) that can be loaded into the Metatrader 5 platform.
Please make yourself familiar with this technical indicator and test it first on a demo account before using it in a real account.
It supports all time frames and Forex pairs.
Download Indicator 🆓
Kalman bands.mq5 Indicator (MT5)
Chart Example
The following chart shows what the Kalman Bands Forex indicator looks like when applied to the MT5 chart.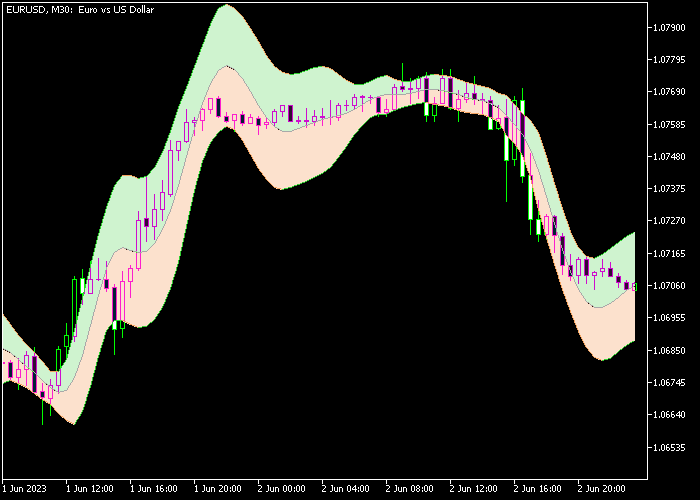
How To Buy And Sell Forex Pairs With The Kalman Bands Indicator?
Find a simple trading example below:
Buy Signal
- A buy signal is formed when the candle touches the lower orange colored Kalman band from above and the Kalman bands are sloping up.
- Open a buy trade and place a stop order below the lower orange colored Kalman band.
- Close the buy trade when price touches the upper green colored Kalman band.
Sell Signal
- A sell signal is formed when the candle touches the upper green colored Kalman band from below and the Kalman bands are sloping down.
- Open a sell trade and place a stop order above the upper green colored Kalman band.
- Close the sell trade when price touches the lower orange colored Kalman band.
Download Now 🆓
Kalman bands.mq5 Indicator (MT5)
Frequently Asked Questions
How Do I Install This Custom Indicator On Metatrader 5?
- Open the MT5 trading platform
- Click on the File menu button located at the top left part of the platform
- Click on Open Data Folder > MQL5 folder > Indicators
- Copy the Kalman bands.mq5 indicator file in the Indicators folder
- Close and restart the trading platform
- You will find the indicator here (Navigator window > Indicators)
- Drag the indicator to the chart to get started with it!
How Do I Edit This Indicator?
- Click in the open chart with your right mouse button
- In the dropdown menu, click on Indicator List
- Select the indicator and click on properties
- Now you can edit the inputs, colors, levels, scale and visualization
- Finally click the OK button to save the new configuration