
The JP Trend Line Analysis indicator for Metatrader 5 performs comprehensive chart analysis and draws accurate trend lines on the price chart.
It plots both support and resistance trend lines on the chart.
How do you trade with it?
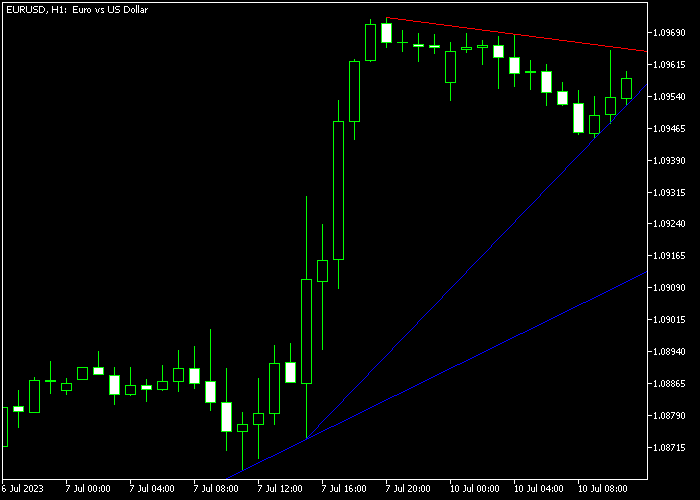
- A bullish signal occurs when the price closes above the red colored resistance trend line.
- A bearish signal occurs when the price closes below the blue colored support trend line.
The indicator contains the following inputs and parameters: max. bars, auto alert, color of support line, color of resistance line, trend deviation.
Make yourself familiar with this technical indicator and test it first on a demo account.
Pro tip: To enhance the likelihood of successful trades in the Forex market, you can combine the JP Trend Line Analysis indicator with various trading techniques and strategies.
Download Indicator 🆓
Chart Example
The picture below shows how the JP Trend Line Analysis indicator looks like when applied to the MT5 chart.
How To Buy And Sell Forex Pairs With The JP Trend Line Analysis Indicator?
Find a simple trading example below:
Buy Signal
- Execute a buy market order when the candle closes above the red colored JP Trend line from below.
- Place a protective stop loss below the most recent swing support.
- Close the buy trade for a potential reward to risk ratio of 2.0, or utilize a fixed profit target of your preference.
Sell Signal
- Execute a sell market order when the candle closes below the blue colored JP Trend line from above.
- Place a protective stop loss above the most recent resistance level.
- Close the sell trade for a potential reward to risk ratio of 2.0, or utilize a fixed profit target of your preference.
Download Now 🆓
Frequently Asked Questions
How Do I Install This Custom Indicator On Metatrader 5?
- Open the MT5 trading platform
- Click on the File menu button located at the top left part of the platform
- Click on Open Data Folder > MQL5 folder > Indicators
- Copy the jptrend.mq5 indicator file in the Indicators folder
- Close and restart the trading platform
- You will find the indicator here (Navigator window > Indicators)
- Drag the indicator to the chart to get started with it!
How Do I Edit This Indicator?
- Click in the open chart with your right mouse button
- In the dropdown menu, click on Indicator List
- Select the indicator and click on properties
- Now you can edit the inputs, colors, levels, scale and visualization
- Finally click the OK button to save the new configuration