
The Heatmap Gradient Scale indicator for Metatrader 5 is a popular technical tool that provides a visual representation of the percentage gain or loss for every currency pair.
The indicator appears in a mini dashboard format in the upper left-hand corner of the trading chart.
The interpretation of the heatmap color scheme is as follows:
- A green colored heatmap indicates a strong bullish trend.
- A light-green colored heatmap suggests a weak bullish trend.
- A red colored heatmap indicates a strong bearish trend.
- A light-red colored heatmap suggests a weak bearish trend.
The indicator includes the following inputs and variables for modification: indicator type (heatmap).
It is recommended to test the Heatmap Gradient Scale indicator on a demo account first before applying it to a real trading account.
Download Indicator 🆓
Heatmap_Gradient_Scale.mq5 Indicator (MT5)
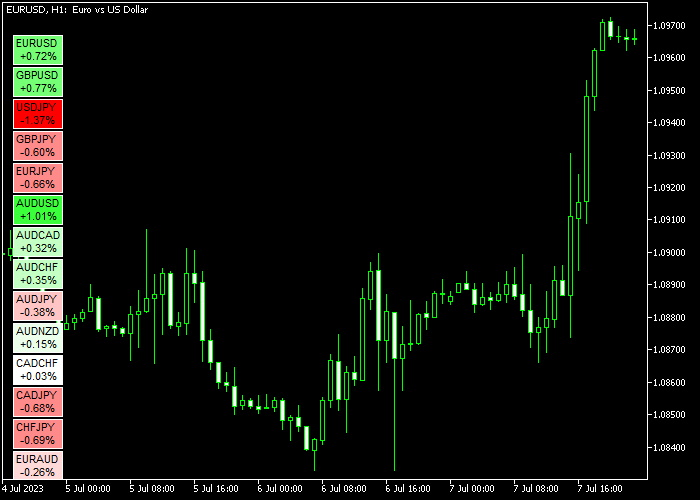
Chart Example
The image below displays what the Heatmap Gradient Scale Forex indicator looks like when applied to the MT5 chart.
How To Buy And Sell Currency Pairs With The Heatmap Gradient Scale Indicator?
Find a simple trading strategy below:
Buy Signal
- Select a green colored heatmap currency pair. This indicates a strong bullish trend.
- Utilize your trading strategy to manage the buy trade (stop loss, entry, take profit).
Sell Signal
- Select a red colored heatmap currency pair. This indicates a strong bearish trend.
- Utilize your own trading strategy to manage the sell trade (stop loss, entry, take profit).
Download Now 🆓
Heatmap_Gradient_Scale.mq5 Indicator (MT5)
Frequently Asked Questions
How Do I Install This Custom Indicator On Metatrader 5?
- Open the MT5 trading platform
- Click on the File menu button located at the top left part of the platform
- Click on Open Data Folder > MQL5 folder > Indicators
- Copy the Heatmap_Gradient_Scale.mq5 indicator file in the Indicators folder
- Close and restart the trading platform
- You will find the indicator here (Navigator window > Indicators)
- Drag the indicator to the chart to get started with it!
How Do I Edit This Indicator?
- Click in the open chart with your right mouse button
- In the dropdown menu, click on Indicator List
- Select the indicator and click on properties
- Now you can edit the inputs, colors, levels, scale and visualization
- Finally click the OK button to save the new configuration