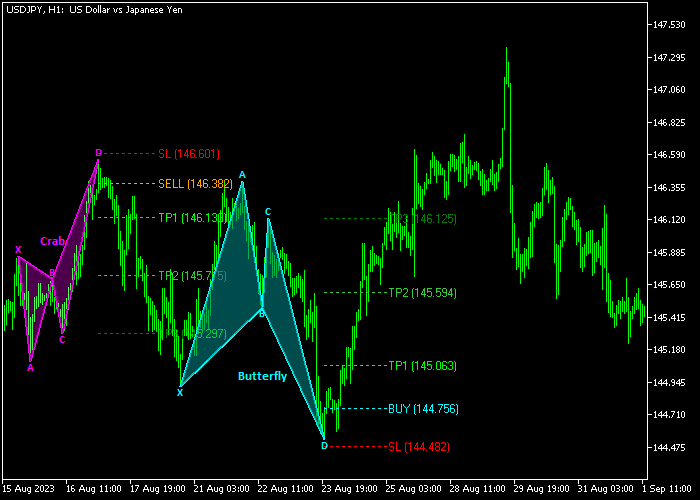
The Harmonic Pattern indicator for Metatrader 5 delivers complete trading signals (stop, entry, take profit levels) based on the Gartley, Bat, Crab, and Butterfly patterns.
Let’s first dive into the different Harmonic patterns:
- The Gartley Pattern
Named after its creator, H.M. Gartley, the Gartley pattern is one of the earliest harmonic patterns identified in the financial markets.
It is a retracement-based pattern that identifies potential reversal points.
The Gartley pattern consists of four price points: X, A, B, and C.
These points are plotted on the chart, and traders look for specific Fibonacci ratios between them.
The classic Gartley pattern is defined by the following ratios:
- AB should be 61.8% of XA.
- BC should be 38.2% of AB.
- CD should be 78.6% of XA.
When these ratios align, it suggests a potential reversal may occur, and traders can look for trading opportunities based on their strategy.
- The Butterfly Pattern
The Butterfly pattern is another powerful harmonic pattern that traders use to identify potential trend reversals.
This pattern has five key points: X, A, B, C, and D.
The ratios that define the Butterfly pattern are as follows:
- AB should be 78.6% of XA.
- BC should be 38.2% of AB.
- CD should be 127.2% of XA.
The Butterfly pattern resembles its namesake with its wingspan-like structure.
Traders consider this pattern as an opportunity to enter or exit a trade when the Fibonacci ratios align.
- The Bat Pattern
The Bat pattern is a lesser-known harmonic pattern, but it is highly effective when recognized correctly.
This pattern, like the others, has X, A, B, C, and D points.
The ratios for the Bat pattern are as follows:
- AB should be 38.2% of XA.
- BC should be 38.2% of AB.
- CD should be 88.6% of XA.
The Bat pattern is often considered an advanced harmonic pattern due to the precision required to spot it.
Traders who can identify this pattern may find themselves in a position to capitalize on strong trend reversals.
- The Crab Pattern
The Crab pattern, as its name suggests, is a bit exotic in the world of harmonic patterns.
It consists of five points: X, A, B, C, and D. The ratios for the Crab pattern are as follows:
- AB should be 38.2% of XA.
- BC should be 61.8% of AB.
- CD should be 224.3% of XA.
The Crab pattern is known for its rarity, but when it does appear on the chart, it can signal significant reversals and present lucrative trading opportunities.
The Harmonic Pattern signal indicator should work equally well for any currency pair and time frame.
The indicator includes several inputs and parameters, such as enable Gartley, enable Crab, enable Butterly, enable Bat, colors, transparency, and more.
Becoming familiar with this technical indicator and thoroughly testing it on a demo account for an extended period is advisable.
Download Indicator 🆓
Basic Harmonic Pattern MT5.ex5 Indicator (MT5)
Chart Example
The picture below illustrates how the Harmonic Pattern indicator with signals indicator looks when applied to the MT5 chart.
How To Buy And Sell Currency Pairs Using The Harmonic Pattern Indicator With Signals Indicator?
Find a simple trading strategy below:
Buy Signal
- A buy signal is generated when a bullish harmonic pattern appears on the chart.
- Execute a buy trade and place the stop loss as suggested by the Harmonic pattern (SL).
- Close the buy trade at any of the suggested take profit levels (TP1, TP2, TP3).
Sell Signal
- A sell signal is generated when a bearish harmonic pattern appears on the chart.
- Execute a sell trade and place the stop loss as suggested by the Harmonic pattern (SL).
- Close the sell trade at any of the suggested take profit levels (TP1, TP2, TP3).
Download Now 🆓
Basic Harmonic Pattern MT5.ex5 Indicator (MT5)
Frequently Asked Questions
How Do I Install This Custom Indicator On Metatrader 5?
- Open the MT5 trading platform
- Click on the File menu button located at the top left part of the platform
- Click on Open Data Folder > MQL5 folder > Indicators
- Copy the Basic Harmonic Pattern MT5.ex5 indicator file in the Indicators folder
- Close and restart the trading platform
- You will find the indicator here (Navigator window > Indicators)
- Drag the indicator to the chart to get started with it!
How Do I Edit This Indicator?
- Click on the open chart with your right mouse button
- In the dropdown menu, click on Indicator List
- Select the indicator and click on the properties
- Now you can edit the inputs, colors, levels, scale, and visualization
- Finally, click the OK button to save the new configuration


