
The Forex Trend Queen indicator for Metatrader 5 is a popular technical tool that delivers accurate buy and sell trend signal arrows.
This indicator thoroughly analyzes various trends and offers reliable buy/sell trade recommendations.
When applied to a price chart, the indicator displays buy and sell arrows in distinct green and red colors.
- A green colored arrow is a buy signal.
- A red colored arrow is a sell signal.
The indicator offers the following adjustable values and input parameters: signal sensitivity control, arrow colors and signal displacement.
The Forex Trend Queen indicator is capable of serving as a standalone signal tool, eliminating the need for additional trading tools.
Download Indicator 🆓
Trendsignal_Indicator.mq5 Indicator (MT5)
Chart Example
Here is how the Forex Trend Queen indicator appears when applied to the MT5 chart.
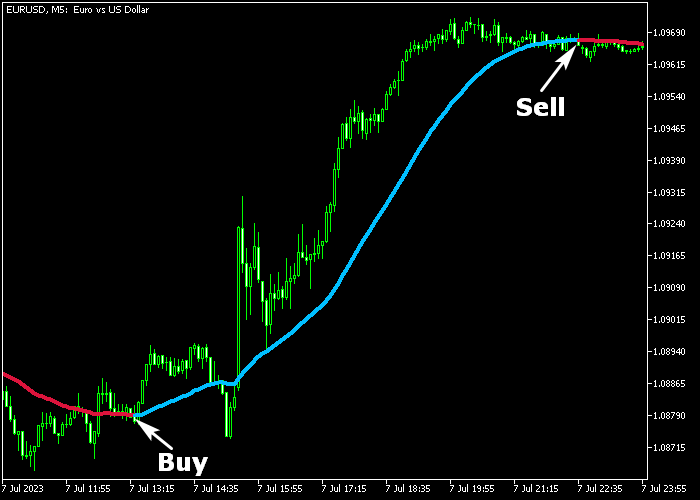
How To Buy And Sell Currency Pairs With The Forex Trend Queen Indicator?
Find a simple trading example below:
Buy Signal
- A buy signal is given when the green colored signal arrow appears on the price chart.
- Open a buy market order and place a stop order below support.
- Exit the buy trade for a fixed profit target, or await a sell signal to close the buy trade.
Sell Signal
- A sell signal is given when the red colored signal arrow appears on the price chart.
- Open a short market order and set a stop loss above resistance.
- Exit the short trade for a fixed profit target, or await a buy signal to close the sell trade.
Download Now 🆓
Trendsignal_Indicator.mq5 Indicator (MT5)
Frequently Asked Questions
How Do I Install This Custom Indicator On Metatrader 5?
- Open the MT5 trading platform
- Click on the File menu button located at the top left part of the platform
- Click on Open Data Folder > MQL5 folder > Indicators
- Copy the Trendsignal_Indicator.mq5 indicator file in the Indicators folder
- Close and restart the trading platform
- You will find the indicator here (Navigator window > Indicators)
- Drag the indicator to the chart to get started with it!
How Do I Edit This Indicator?
- Click in the open chart with your right mouse button
- In the dropdown menu, click on Indicator List
- Select the indicator and click on properties
- Now you can edit the inputs, colors, levels, scale and visualization
- Finally click the OK button to save the new configuration