
The Forex tick chart indicator for Metatrader 5 draws a tick chart along with the corresponding bid and ask prices in a dedicated chart window.
With each new tick, the chart updates all relevant data, including the bid and ask prices.
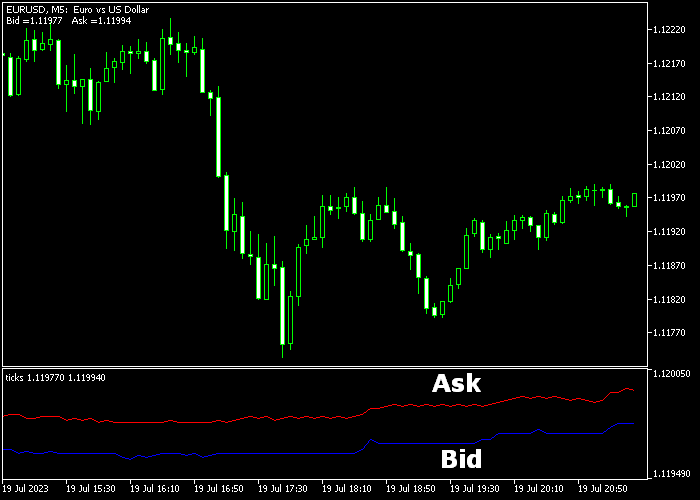
- The bid price line is colored blue.
- The ask price line is colored red.
You can adjust the following parameters: number of ticks and points.
This indicator seamlessly works with all Forex pairs supported by the MT5 charting platform.
Download Indicator 🆓
Chart Example
The image presented below showcases the Forex Tick Chart indicator when applied to the MT5 charting platform.
How To Buy And Sell Forex Pairs With The Forex Tick Chart Indicator?
The indicator does not generate buy or sell signals, it only displays the Forex tick chart in a dedicated chart window.
Combine it with an existing trading strategy or buy/sell technical indicators.
Download Now 🆓
Frequently Asked Questions
How Do I Install This Custom Indicator On Metatrader 5?
- Open the MT5 trading platform
- Click on the File menu button located at the top left part of the platform
- Click on Open Data Folder > MQL5 folder > Indicators
- Copy the ticks.mq5 indicator file in the Indicators folder
- Close and restart the trading platform
- You will find the indicator here (Navigator window > Indicators)
- Drag the indicator to the chart to get started with it!
How Do I Edit This Indicator?
- Click in the open chart with your right mouse button
- In the dropdown menu, click on Indicator List
- Select the indicator and click on properties
- Now you can edit the inputs, colors, levels, scale and visualization
- Finally click the OK button to save the new configuration