
The Forex Profit Bands indicator for Metatrader 5 measures market volatility + trend direction and provides buying and selling trade opportunities.
Generally speaking, wide profit bands indicate higher volatility while narrower bands indicate less volatility.
How to spot the market trend with this technical analysis tool?
- Upward-sloping bands represent a bullish currency market.
- Downward-sloping bands represent a bearish currency market.
The following indicator inputs and parameters can be modified: period of bands, deviation level, and colors.
The indicator works for any trading instrument (Forex, Stocks, Indices, Metals, etc.) that can be loaded into the Metatrader 5 platform.
Please make yourself familiar with this technical indicator and test it first on a demo account.
It supports all time frames and Forex pairs.
Download Indicator 🆓
KoliErBands.mq5 Indicator (MT5)
Chart Example
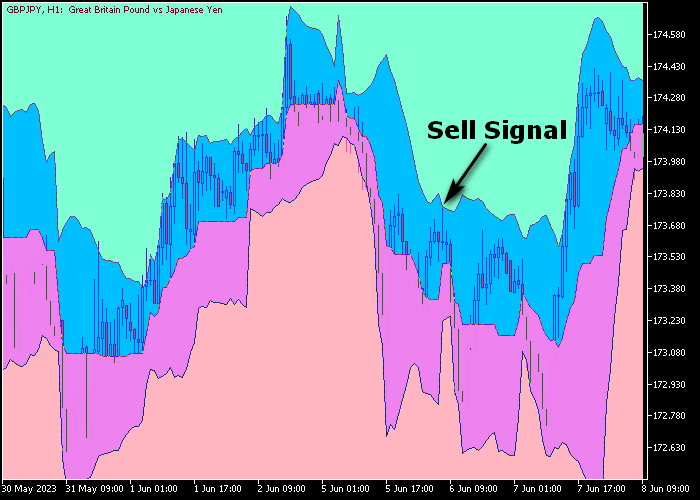
The following chart shows what the Forex Profit Bands indicator looks like when applied to the MT5 chart.
How To Buy And Sell Currency Pairs With The Forex Profit Bands Indicator?
Find a simple trading example below:
Buy Signal
- A buy signal occurs when the candle touches the lower magenta colored band and the profit bands are sloping upward.
- Open a buy trade and place your stop loss below the lower magenta colored profit band.
- Close the buy trade when price touches the upper blue colored profit band.
Sell Signal
- A sell signal occurs when the candle touches the upper blue colored band and the profit bands are sloping downward.
- Open a sell trade and place your stop loss above the upper blue colored profit band (see chart example above).
- Close the buy trade when price touches the lower magenta colored profit band.
Download Now 🆓
KoliErBands.mq5 Indicator (MT5)
Frequently Asked Questions
How Do I Install This Custom Indicator On Metatrader 5?
- Open the MT5 trading platform
- Click on the File menu button located at the top left part of the platform
- Click on Open Data Folder > MQL5 folder > Indicators
- Copy the KoliErBands.mq5 indicator file in the Indicators folder
- Close and restart the trading platform
- You will find the indicator here (Navigator window > Indicators)
- Drag the indicator to the chart to get started with it!
How Do I Edit This Indicator?
- Click in the open chart with your right mouse button
- In the dropdown menu, click on Indicator List
- Select the indicator and click on properties
- Now you can edit the inputs, colors, levels, scale and visualization
- Finally click the OK button to save the new configuration