

The Forex Price Heatmap V1.05 indicator for Metatrader 5 draws a heatmap on the chart that can be used for both trade entry and take profit.
The indicator determines the trend as follows:
- An upward-sloping Price Heatmap indicates a bullish market trend.
- A downward-sloping Price Heatmap suggests a bearish market trend.
The indicator includes the following inputs and variables for modification: histogram time frame, period, range, show bars, and colors.
It is recommended to test the Forex Price Heatmap Version 1.05 indicator on a demo account first before applying it to a real trading account.
Download Indicator 
price_heatmap_v1.05.mq5 Indicator (MT5)
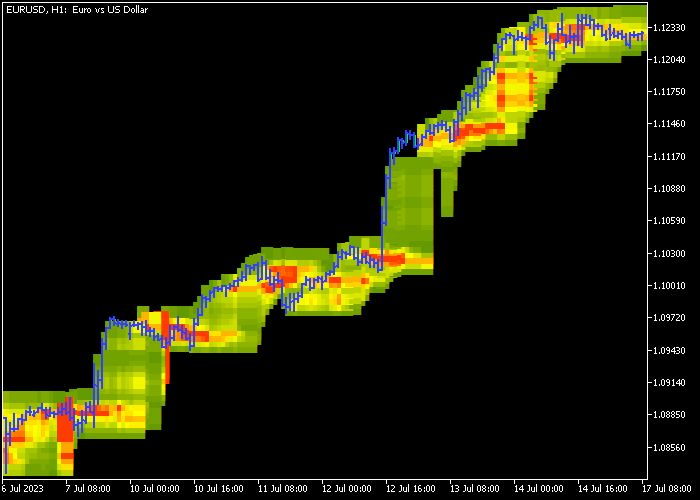
Chart Example
The image below displays how the Price Heatmap V1.05 indicator looks like when applied to the MT5 chart.
How To Buy And Sell Currency Pairs With The Forex Price Heatmap V1.05 Indicator?
Find a simple trading strategy below:
Buy Signal
- Buy condition: the Forex Price Heatmap should be trending upward.
- Wait for the price to touch the lower part of the Price Heatmap.
- Initiate a buy trade and position a stop loss order just below short-term support.
- Exit the buy trade when the candlestick touches the upper region of the Price Heatmap.
Sell Signal
- Sell condition: the Forex Price Heatmap should be trending downward.
- Wait for the price to touch the upper part of the Price Heatmap.
- Initiate a sell trade and position a stop loss order just above short-term resistance.
- Exit the sell trade when the candlestick touches the lower region of the Price Heatmap.
Download Now
price_heatmap_v1.05.mq5 Indicator (MT5)
Frequently Asked Questions
How Do I Install This Custom Indicator On Metatrader 5?
- Open the MT5 trading platform
- Click on the File menu button located at the top left part of the platform
- Click on Open Data Folder > MQL5 folder > Indicators
- Copy the price_heatmap_v1.05.mq5 indicator file in the Indicators folder
- Close and restart the trading platform
- You will find the indicator here (Navigator window > Indicators)
- Drag the indicator to the chart to get started with it!
How Do I Edit This Indicator?
- Click in the open chart with your right mouse button
- In the dropdown menu, click on Indicator List
- Select the indicator and click on properties
- Now you can edit the inputs, colors, levels, scale and visualization
- Finally click the OK button to save the new configuration