The Figurelli Series indicator for Metatrader 5 is a robust trading tool that provides buy & sell signals to both scalpers and intraday Forex traders.
The indicator gets displayed in a dedicated chart window as orange colored trend bars that oscillate above and below 0.
Understanding the Figurelli Series indicator:
- An orange colored trend bar above 0 is considered bullish.
- An orange colored trend bar below 0 is considered bearish.
The indicator contains the following inputs and parameters: initial period, period calculation step, number of moving averages, smoothing type, time series, and horizontal shift.
Make yourself familiar with this technical indicator and test it first on a demo account for an extended period.
Remember to have realistic expectations, performance will vary depending on market conditions (trending markets, sideways markets, etc.).
Download Indicator 🆓
figurelliseries.mq5 Indicator (MT5)
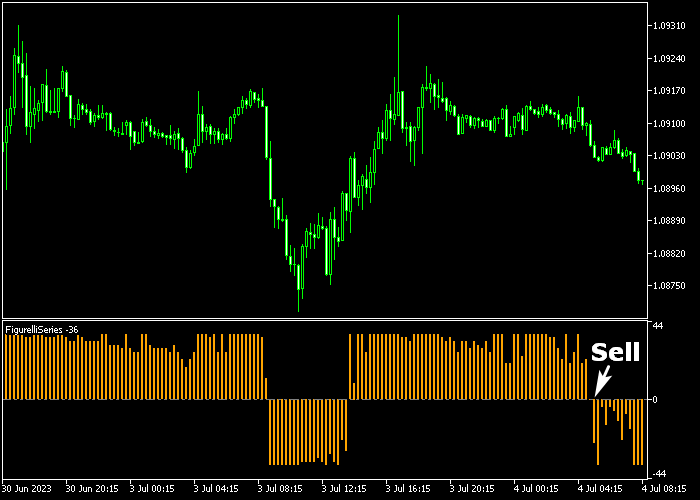
Chart Example
The image below shows how the Figurelli Series indicator looks like when applied to the MT5 chart.

How To Buy And Sell Forex Pairs With The Figurelli Series Technical Indicator?
Find a simple trading example below:
Buy Signal
- A buy signal occurs when the orange colored Figurelli Series trend bar appears above the 0 level.
- Open a buy market order and set a protective stop loss below short-term support.
- Exit the buy trade for 10-25 pips profit.
- Alternatively, reverse the buy trade if the Figurelli Series trend bar reverts back below 0.
Sell Signal
- A sell signal occurs when the orange colored Figurelli Series trend bar appears below the 0 level.
- Open a sell market order and set a protective stop loss above short-term resistance.
- Exit the sell trade for 10-25 pips profit.
- Alternatively, reverse the sell trade if the Figurelli Series trend bar reverts back above 0.
Download Now 🆓
figurelliseries.mq5 Indicator (MT5)
Frequently Asked Questions
How Do I Install This Custom Indicator On Metatrader 5?
- Open the MT5 trading platform
- Click on the File menu button located at the top left part of the platform
- Click on Open Data Folder > MQL5 folder > Indicators
- Copy the figurelliseries.mq5 indicator file in the Indicators folder
- Close and restart the trading platform
- You will find the indicator here (Navigator window > Indicators)
- Drag the indicator to the chart to get started with it!
How Do I Edit This Indicator?
- Click in the open chart with your right mouse button
- In the dropdown menu, click on Indicator List
- Select the indicator and click on properties
- Now you can edit the inputs, colors, levels, scale and visualization
- Finally click the OK button to save the new configuration