The Fibonacci Arc indicator for Metatrader 5 is a drawing tool that enables traders to draw Fibonacci Arcs on the price chart.
Fibonacci Arcs act as support and resistance levels and can be constructed as follows with this indicator:
Draw a trend line with this indicator between two extreme points and the Fibonacci Arc will automatically appear on the chart.
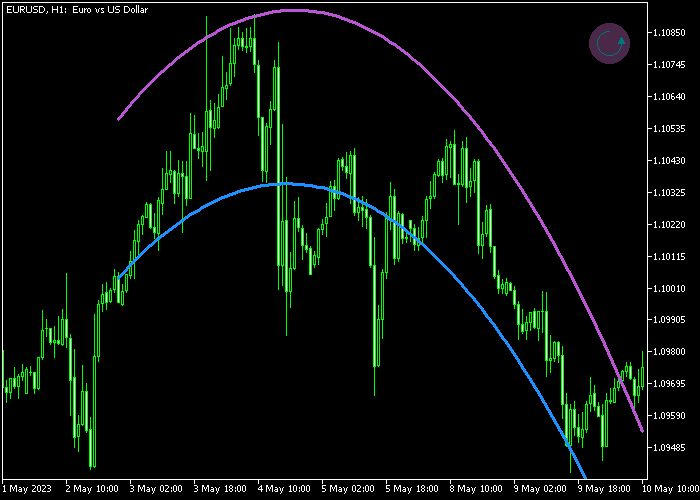
- The purple colored Fibonacci Arc line acts as resistance.
- The blue colored Fibonacci Arc line acts as support.
The indicator contains the following inputs and parameters: arc up color, arc down color, and style.
Make yourself familiar with this technical indicator and test it first on a demo account for an extended period.
It supports all time frames and Forex pairs.
Download Indicator 🆓
Chart Example
The following chart shows what the Fibonacci Arc Forex indicator looks like when applied to the MT5 chart.

How To Buy And Sell Forex Pairs With The Fibonacci Arc Indicator?
Find a simple trading example below:
Buy Signal
- A buy signal is given when price touches the lower blue colored Fibonacci Arc line and the general trend is upward.
- Open a buy trade and place your stop loss below the blue colored Fibonacci Arc support line.
- Close the trade when price touches the purple colored Fibonacci Arc resistance line.
Sell Signal
- A sell signal is given when price touches the upper purple colored Fibonacci Arc line and the general trend is downward.
- Open a sell trade and place your stop loss above the purple colored Fibonacci Arc resistance line.
- Close the trade when price touches the blue colored Fibonacci Arc support line.
Download Now 🆓
Frequently Asked Questions
How Do I Install This Custom Indicator On Metatrader 5?
- Open the MT5 trading platform
- Click on the File menu button located at the top left part of the platform
- Click on Open Data Folder > MQL5 folder > Indicators
- Copy the Arc.mq5 indicator file in the Indicators folder
- Close and restart the trading platform
- You will find the indicator here (Navigator window > Indicators)
- Drag the indicator to the chart to get started with it!
How Do I Edit This Indicator?
- Click in the open chart with your right mouse button
- In the dropdown menu, click on Indicator List
- Select the indicator and click on properties
- Now you can edit the inputs, colors, levels, scale and visualization
- Finally click the OK button to save the new configuration