
The Dynamic Zone RSI Forex indicator for Metatrader 5 is based on RSI + Bollinger Bands and it can be used for trade entry and exit signals.
The indicator appears in a separate chart window as two red colored dynamically moving Bollinger Bands and a blue colored RSI signal line.
The Bollinger Bands follow the overall trend and the RSI indicator identifies overbought and oversold market conditions.
How to spot market trends with the Dynamic Zone RSI indicator?
- The trend is upward when the Bollinger Bands are sloping up.
- The trend is downward when the Bollinger Bands are sloping down.
The indicator works for any time frame, or trading instrument and is newbie friendly.
The indicator has the following inputs and parameters: RSI period, BB period, deviation, show intersection arrows, and use alerts.
First, familiarize yourself with this technical indicator and test it on a demo account.
It supports all time frames and Forex pairs.
Download Indicator 🆓
Dynamic_Zone_RSI.mq5 Indicator (MT5)
Chart Example
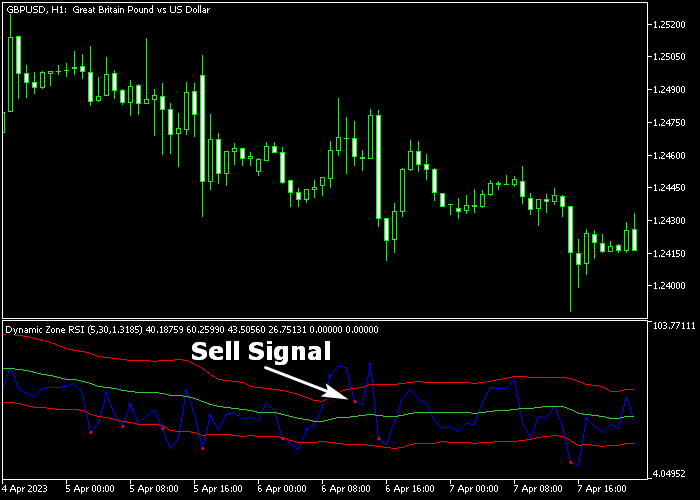
The following chart shows how the Dynamic Zone RSI indicator looks like when applied to the MT5 chart.
How To Buy And Sell Forex Pairs With The Dynamic Zone RSI Forex Indicator?
Find a simple trading example below:
Buy Signal
- A buy signal is given when the Bollinger Bands are sloping up and the RSI indicator paints a red oversold bullet below the green middle line.
- Open a buy order and place your stop loss below the most recent swing low zone.
- Close the buy trade for a fixed take profit target of your preference.
Sell Signal
- A sell signal is given when the Bollinger Bands are sloping down and the RSI indicator paints a red overbought bullet above the green middle line.
- Open a sell order and place your stop loss above the most recent swing high zone.
- Close the sell trade for a fixed take profit target of your preference.
Download Now 🆓
Dynamic_Zone_RSI.mq5 Indicator (MT5)
Frequently Asked Questions
How Do I Install This Custom Indicator On Metatrader 5?
- Open the MT5 trading platform
- Click on the File menu button located at the top left part of the platform
- Click on Open Data Folder > MQL5 folder > Indicators
- Copy the Dynamic_Zone_RSI.mq5 indicator file in the Indicators folder
- Close and restart the trading platform
- You will find the indicator here (Navigator window > Indicators)
- Drag the indicator to the chart to get started with it!
How Do I Edit This Indicator?
- Click in the open chart with your right mouse button
- In the dropdown menu, click on Indicator List
- Select the indicator and click on properties
- Now you can edit the inputs, colors, levels, scale and visualization
- Finally click the OK button to save the new configuration