
The Double MA Cross Forex Signal indicator for Metatrader 5 is a crossover trading system based on a slow and fast moving average.
It’s a popular technical indicator that generates the most profit in trending markets.
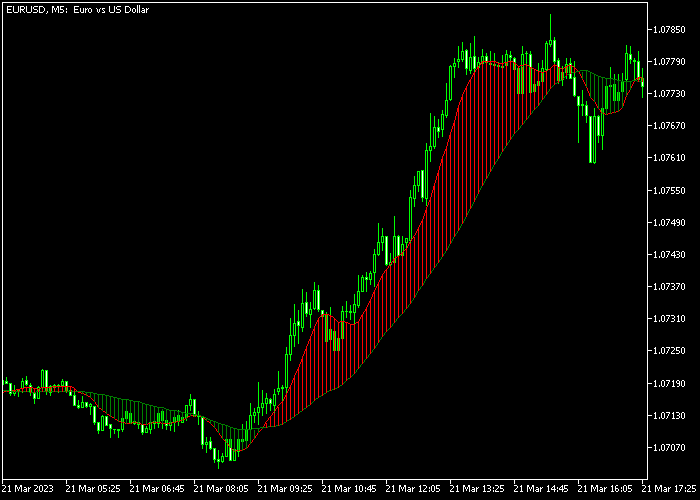
The indicator pops up in the main chart as a colored buy and sell cloud.
- A red double MA cross cloud is bullish trading signal.
- A green double MA cross cloud is bearish trading signal.
The following indicator inputs can be modified: fast MA time frame, fast MA period, shift, slow MA time frame, slow MA period, method, and applied price.
The indicator works pretty well for any trading style (scalping, day trading, swing trading).
First, familiarize yourself with this technical indicator and test it on a demo account.
It supports all time frames, Forex pairs, and any other trade instrument.
Download Indicator 🆓
Double MA Cross.mq5 Indicator (MT5)
Chart Example
The following chart shows what the Double MA Cross Forex Signal indicator looks like when applied to the MT5 chart.
How To Buy And Sell Forex Pairs With The Double MA Cross Forex Signal Indicator?
Find a simple trading example below:
Buy Signal
- A buy signal is given when the cloud is colored red.
- Open a buy trade and place your stop loss below the red MA cloud.
- Exit the buy trade for a fixed take profit target, or wait for the green cloud to appear on the chart.
Sell Signal
- A sell signal is given when the cloud is colored green.
- Open a sell trade and place your stop loss above the green MA cloud.
- Exit the sell trade for a fixed take profit target, or wait for the red cloud to appear on the chart.
Download Now 🆓
Double MA Cross.mq5 Indicator (MT5)
Frequently Asked Questions
How Do I Install This Custom Indicator On Metatrader 5?
- Open the MT5 trading platform
- Click on the File menu button located at the top left part of the platform
- Click on Open Data Folder > MQL5 folder > Indicators
- Copy the Double MA Cross.mq5 indicator file in the Indicators folder
- Close and restart the trading platform
- You will find the indicator here (Navigator window > Indicators)
- Drag the indicator to the chart to get started with it!
How Do I Edit This Indicator?
- Click in the open chart with your right mouse button
- In the dropdown menu, click on Indicator List
- Select the indicator and click on properties
- Now you can edit the inputs, colors, levels, scale and visualization
- Finally click the OK button to save the new configuration