The Directional Momentum Forex Signal indicator for Metatrader 5 is a super easy to use buy/sell technical tool that works for any FX pair.
The indicator is displayed in a separate chart window as a blue and brown colored signal line.
How to trade with it?
- A blue colored line forecasts a rising market trend.
- A brown colored line forecasts a declining market trend.
The following indicator inputs and parameters can be modified: momentum period, average period, average method, and price.
For scalping and intraday traders: the indicator tends to produce the best results during the London and American trading sessions.
Make yourself familiar with this technical indicator and test it first on a demo account for an extended period.
Download Indicator 🆓
Directional momentum of average.mq5 Indicator (MT5)
Chart Example
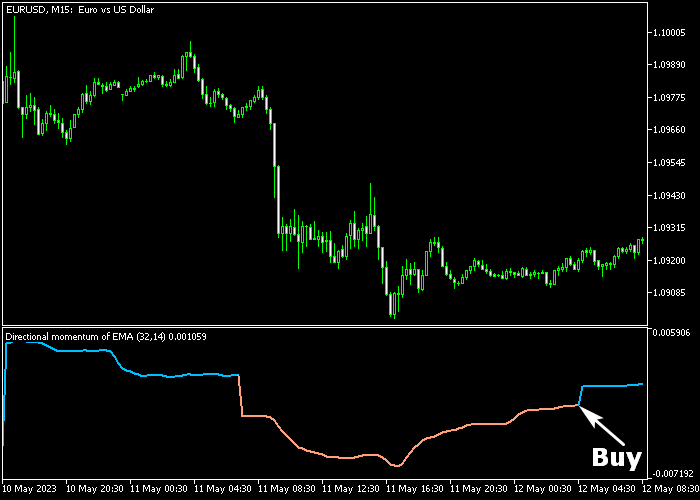
The following chart shows how the Directional Momentum Forex Signal indicator looks when applied to the MT5 chart.

How To Buy And Sell Currency Pairs With The Directional Momentum Forex Signal Indicator?
Find a simple trading example below:
Buy Signal
- The appearance of the blue colored signal line is a buy trade signal (see chart above).
- Open a buy trade and place you initial stop loss slightly below support.
- Close the buy trade for a fixed profit target, or wait for a sell signal.
Sell Signal
- The appearance of the brown colored signal line is a sell trade signal.
- Open a sell trade and place your initial stop loss slightly above resistance.
- Close the sell trade for a fixed profit target, or wait for a buy signal.
Download Now 🆓
Directional momentum of average.mq5 Indicator (MT5)
Frequently Asked Questions
How Do I Install This Custom Indicator On Metatrader 5?
- Open the MT5 trading platform
- Click on the File menu button located at the top left part of the platform
- Click on Open Data Folder > MQL5 folder > Indicators
- Copy the Directional momentum of average.mq5 indicator file in the Indicators folder
- Close and restart the trading platform
- You will find the indicator here (Navigator window > Indicators)
- Drag the indicator to the chart to get started with it!
How Do I Edit This Indicator?
- Click in the open chart with your right mouse button
- In the dropdown menu, click on Indicator List
- Select the indicator and click on properties
- Now you can edit the inputs, colors, levels, scale and visualization
- Finally click the OK button to save the new configuration