
The Camarilla Pivot Points indicator for Metatrader 5 is a versatile technical tool that helps traders pinpoint entry points, exit points, and stop loss levels.
It is displayed on the chart as the actual Camarilla Pivot Point and the accompanying support and resistance levels.
How to identify bullish and bearish market sentiment with this trading tool?
- Price action above the Camarilla Pivot Point creates a bullish market sentiment.
- Price action below the Camarilla Pivot Point creates a bearish market sentiment.
The following indicator inputs and variables can be modified: C period (1 day), H1-H5 level labels
Camarilla Pivot Points should work equally well across all time frames and trading instruments (Forex, Gold, Indices, Stocks, etc.).
Make yourself familiar with this technical indicator and test it first on a demo account for an extended period of time.
Download Indicator 🆓
camarilla_full.mq5 Indicator (MT5)
Chart Example
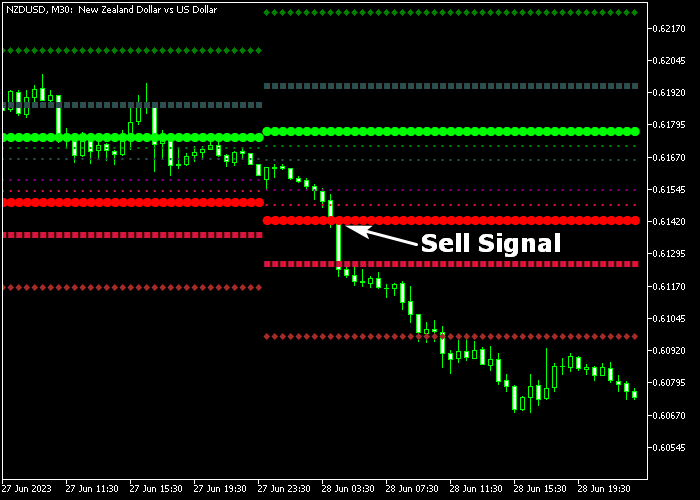
The image below shows what the Camarilla Pivot Points indicator looks like when applied to the MT5 chart.
How To Buy And Sell Currency Pairs With The Camarilla Pivot Points Indicator?
Find a simple trading example below:
Buy Signal
- A buy signal is given when the price crosses above the green thick colored line from below.
- Open a buy trade and place a protective stop loss below the red thick colored line.
- Exit the buy trade when the price touches any of the green colored upper Camarilla resistance lines.
Sell Signal
- A sell signal is given when the price crosses below the red thick colored line from above (see chart example above).
- Open a sell trade and place a protective stop loss above the green thick colored line.
- Exit the sell trade when the price touches any of the red colored lower Camarilla support lines.
Download Now 🆓
camarilla_full.mq5 Indicator (MT5)
Frequently Asked Questions
How Do I Install This Custom Indicator On Metatrader 5?
- Open the MT5 trading platform
- Click on the File menu button located at the top left part of the platform
- Click on Open Data Folder > MQL5 folder > Indicators
- Copy the camarilla_full.mq5 indicator file in the Indicators folder
- Close and restart the trading platform
- You will find the indicator here (Navigator window > Indicators)
- Drag the indicator to the chart to get started with it!
How Do I Edit This Indicator?
- Click in the open chart with your right mouse button
- In the dropdown menu, click on Indicator List
- Select the indicator and click on properties
- Now you can edit the inputs, colors, levels, scale and visualization
- Finally click the OK button to save the new configuration