The Bollinger Bands Breakout indicator for Metatrader 5 provides buy & sell signal arrows when the price breaks above or below the Bollinger bands.
The indicator pops up in the main chart as Bollinger bands along with the buy & sell signal arrows.
The buy and sell trade logic goes as follows:
- A buy breakout occurs when the candle closes above the upper Bollinger band.
- A sell breakout occurs when the candle closes below the lower Bollinger band.
The BB breakout indicator works for any trade style of your preference.
The indicator contains the following inputs and parameters: bollinger bands period (20), price, deviation, ATR multiplier, zones percent, style.
First, familiarize yourself with this technical indicator and test it on a demo account.
It supports all time frames and Forex pairs.
Download Indicator 🆓
Bollinger bands (breakout).mq5 Indicator (MT5)
Chart Example
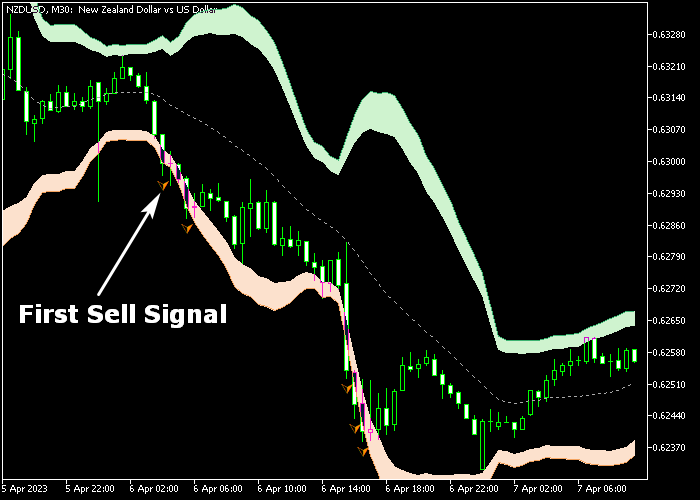
The following chart shows how the BB Breakout Forex indicator looks like when applied to the MT5 chart.

How To Buy And Sell Forex Pairs With The Bollinger Bands Breakout Forex Indicator?
Find a simple trading example below:
Buy Signal
- A buy signal is given as soon as the green colored signal arrow gets displayed on the chart.
- Open a buy trade and place your stop loss below the lower Bollinger band.
- Close the buy trade for a reward to risk ratio of at least 1.5, or utilize your own exit strategy.
Sell Signal
- A sell signal is given as soon as the orange colored signal arrow gets displayed on the chart.
- Open a sell trade and place your stop loss above the upper Bollinger band.
- Close the sell trade for a reward to risk ratio of at least 1.5, or utilize your own exit strategy.
Download Now 🆓
Bollinger bands (breakout).mq5 Indicator (MT5)
Frequently Asked Questions
How Do I Install This Custom Indicator On Metatrader 5?
- Open the MT5 trading platform
- Click on the File menu button located at the top left part of the platform
- Click on Open Data Folder > MQL5 folder > Indicators
- Copy the Bollinger bands (breakout).mq5 indicator file in the Indicators folder
- Close and restart the trading platform
- You will find the indicator here (Navigator window > Indicators)
- Drag the indicator to the chart to get started with it!
How Do I Edit This Indicator?
- Click in the open chart with your right mouse button
- In the dropdown menu, click on Indicator List
- Select the indicator and click on properties
- Now you can edit the inputs, colors, levels, scale and visualization
- Finally click the OK button to save the new configuration