The BMI Long indicator for MT4 is a great signals indicator based on the MACD, Bollinger Bands and Stochastics technical indicators.
The indicator appears in a separate MT4 chart window in the form of colored signal lines.
When all lines trade in agreement, this will result in either a buy or sell signal.
The BMI Long indicator is simple to use, even for newbie traders.
Key Takeaways:
- The trend is considered bullish when all signal lines trade above the 0.00 neutral level.
- The trend is considered bearish when all signal lines trade below the 0.00 neutral level.
- Based on a mix of technical indicator.
- Keeps you out of range-bound currency markets.
The indicator works equally well on all assets (Forex, CFD stocks, Indices, Cryptocurrencies, Commodities,..) and shows promising results if used correctly.
Free Download:
Download the “bmi-long.ex4” indicator for MT4
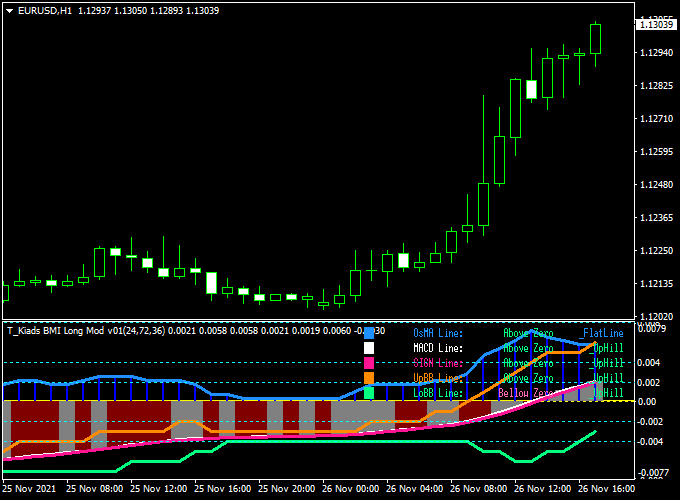
Indicator Example Chart (EUR/USD H1)
The example chart below displays the BMI Long indicator in action on the trading chart.

Trading Signals (example):
Buy signal: A buy signal occurs whenever all signal lines appear above the 0.00 level. The trend is now bullish.
Sell signal: A sell signal occurs whenever all signal lines appear below the 0.00 level. The trend is now bearish.
As always, please trade in agreement with the overall trend and practice on a demo account first.
Utilize your own favorite stop loss and take profit method.
Indicator Specifications & Inputs:
Trading Platform: Developed for Metatrader 4 (MT4)
Currency pairs: Works for any pair
Time frames: Works for any time frame
Input Parameters: Variable (inputs tab), color settings & style
Indicator type: Trading signals
Repaint? No.
Download Now:
Download the “bmi-long.ex4” indicator for Metatrader 4
Installation:
Open the Metatrader 4 platform
From the top menu, click on “File”
Then click on “Open Data Folder”
Then double click with your mouse button on “MQL4”
Now double click on “Indicators”
Paste the bmi-long.ex4 indicator in the Indicators folder.
Finally restart the MT4 platform and attach the indicator to any chart.
How to remove the indicator?
Click with your right mouse button in the chart with the indicator attached onto it.
Select “Indicator List” from the drop down menu.
Select the indicator and press delete.
How to edit the indicator’s inputs and parameters?
Right click with your mouse button in the chart with the indicator attached onto it.
From the drop down menu, click on indicators list.
Select the indicator from the list and press edit.
Now you can edit the indicator.
Finally, press the OK button to save the updated configuration.