The Binary Swing Line Forex Scalper for Metatrader 5 is some sort of binary indicator that delivers rapid trade entry signals for scalpers.
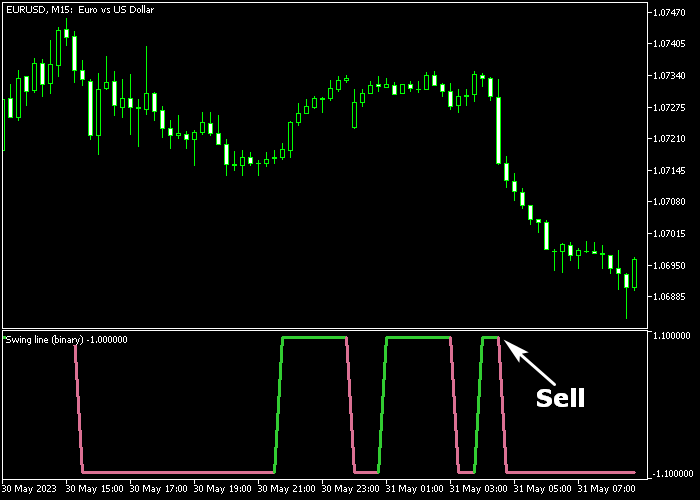
The indicator appears in a bottom chart as a green and violet colored signal line.
The Binary Swing Line indicator uses two colors to determine the buying and selling state:
- The green colored binary line is a buy signal.
- The violet colored binary line is a sell signal.
The indicator can be used as a standalone scalper tool.
The following indicator inputs and parameters can be modified: colors.
Please make yourself familiar with this technical indicator and test it first on a demo account to gain confidence before using it in a real trading account.
It supports all time frames and Forex pairs.
Download Indicator 🆓
Swing line (binary).mq5 Indicator (MT5)
Chart Example
The following chart shows how the Binary Swing Line Forex Scalper indicator looks when applied to the MT5 chart.

How To Buy And Sell Forex Pairs With The Binary Swing Line Forex Scalper?
Find a simple trading example below:
Buy Signal
- A buy signal is given when the green colored binary line gets displayed in the chart.
- Open a buy trade and place your stop loss below immediate support.
- Close the buy trade for possible 6-15 pips, or wait for a sell reversal signal.
Sell Signal
- A sell signal is given when the violet colored binary line gets displayed in the chart.
- Open a sell trade and place your stop loss above immediate resistance.
- Close the sell trade for possible 6-15 pips, or wait for a buy reversal signal.
Download Now 🆓
Swing line (binary).mq5 Indicator (MT5)
Frequently Asked Questions
How Do I Install This Custom Indicator On Metatrader 5?
- Open the MT5 trading platform
- Click on the File menu button located at the top left part of the platform
- Click on Open Data Folder > MQL5 folder > Indicators
- Copy the Swing line (binary).mq5 indicator file in the Indicators folder
- Close and restart the trading platform
- You will find the indicator here (Navigator window > Indicators)
- Drag the indicator to the chart to get started with it!
How Do I Edit This Indicator?
- Click in the open chart with your right mouse button
- In the dropdown menu, click on Indicator List
- Select the indicator and click on properties
- Now you can edit the inputs, colors, levels, scale and visualization
- Finally click the OK button to save the new configuration