The Bigger Time Frames Candles Forex indicator displays bigger time frame bullish & bearish candles on the MT4 main chart window.
The bullish and bearish candles are based on the bigger time frames and gives you an idea where the major trend is heading to.
The indicator can be used to trade breakouts above or below the bigger candlesticks.
Key Takeaways:
- A blue candlestick represents an up trending market.
- A red candlestick represents a down trending market.
- Pure price action, no lag.
- Simple to use.
The indicator works equally well for all currency pairs and shows promising results if used correctly.
Free Download:
Download the “bigger-tf-candles-week-day.mq4” indicator for MT4
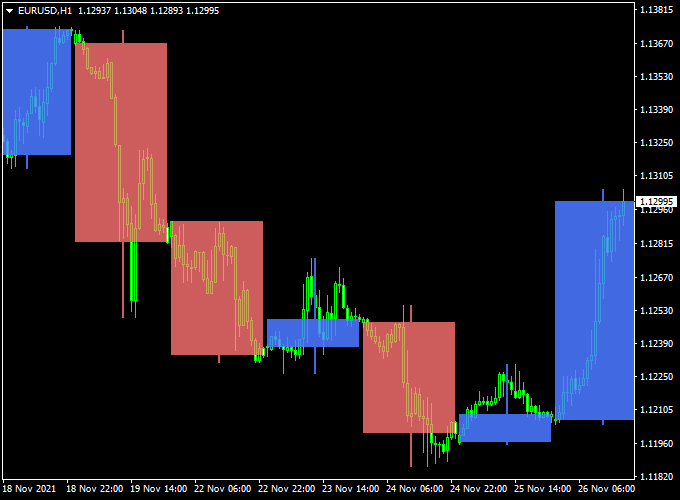
Indicator Example Chart (EUR/USD H1)
The example chart below displays the Bigger Time Frames Candles indicator in action on the trading chart.

Trading Signals (example):
Buy signal: A buy signal occurs as soon as the blue candlestick gets printed on the chart.
Sell signal: A sell signal occurs as soon as the red candlestick gets printed on the chart.
As always, please trade in agreement with the overall trend.
Utilize your own favorite stop loss and take profit method.
Indicator Specifications & Inputs:
Trading Platform: Developed for Metatrader 4 (MT4)
Currency pairs: Works for any pair
Time frames: Works for any time frame
Input Parameters: Variable (inputs tab), color settings & style
Indicator type: Candlestick
Repaint? No.
Download Now:
Download the “bigger-tf-candles-week-day.mq4” indicator for Metatrader 4
Installation:
Open the Metatrader 4 platform
From the top menu, click on “File”
Then click on “Open Data Folder”
Then double click with your mouse button on “MQL4”
Now double click on “Indicators”
Paste the bigger-tf-candles-week-day.mq4 indicator in the Indicators folder.
Finally restart the MT4 platform and attach the indicator to any chart.
How to remove the indicator?
Click with your right mouse button in the chart with the indicator attached onto it.
Select “Indicator List” from the drop down menu.
Select the indicator and press delete.
How to edit the indicator’s inputs and parameters?
Right click with your mouse button in the chart with the indicator attached onto it.
From the drop down menu, click on indicators list.
Select the indicator from the list and press edit.
Now you can edit the indicator.
Finally, press the OK button to save the updated configuration.