
The Basic Bollinger Band Squeeze indicator for Metatrader 4 delivers profitable trading signals for any pair and is a simplified version of the advanced Bollinger Band Squeeze indicator.
The indicator appears in a separate MT4 chart window as a colored bar histogram that defines the trend.
Buying and selling pairs with this indicator works out of the box.
Just load it on the chart to getting started.
Key Takeaways:
- A bullish trend occurs when the histogram bars are positioned above the zero level.
- A bearish trend occurs when the histogram bars are positioned below the zero level.
- Works great for scalping and day trading.
- Works on Bollinger Bands.
Free Download:
Download the “bollinger-squeeze-basic.mq4” indicator for MT4
Indicator Example Chart (EUR/USD H1)
The example chart below displays the Basic Bollinger Band Squeeze indicator in action on the trading chart.
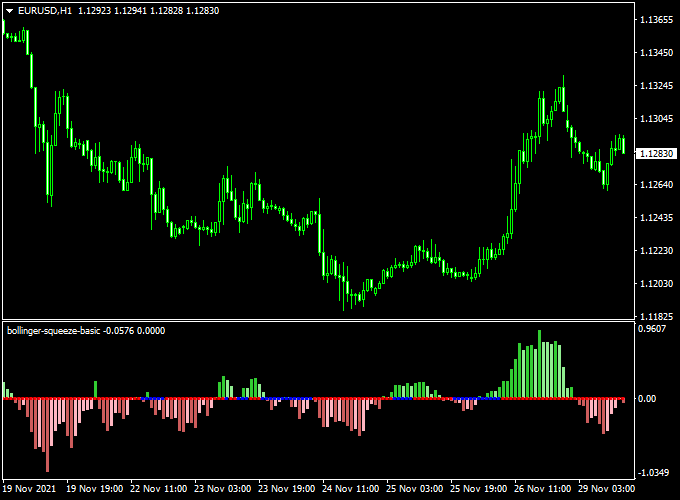
Trading Signals (example):
Buy signal: Open a buy trade as soon as the Basic Bollinger Band Squeeze histogram crosses the 0.00 level bottom-up.
Sell signal: Open a sell trade as soon as the Basic Bollinger Band Squeeze histogram crosses the 0.00 level top-down.
As always, please trade in agreement with the overall trend and practice on a demo account first.
Utilize your own favorite stop loss and take profit method.
Indicator Specifications & Inputs:
Trading Platform: Developed for Metatrader 4 (MT4)
Currency pairs: Works for any pair
Time frames: Works for any time frame
Input Parameters: Variable (inputs tab), color settings & style
Indicator type: Trading signals
Repaint? No.
Download Now:
Download the “bollinger-squeeze-basic.mq4” indicator for Metatrader 4
Installation:
Open the Metatrader 4 platform
From the top menu, click on “File”
Then click on “Open Data Folder”
Then double click with your mouse button on “MQL4”
Now double click on “Indicators”
Paste the bollinger-squeeze-basic.mq4 indicator in the Indicators folder.
Finally restart the MT4 platform and attach the indicator to any chart.
How to remove the indicator?
Click with your right mouse button in the chart with the indicator attached onto it.
Select “Indicator List” from the drop down menu.
Select the indicator and press delete.
How to edit the indicator’s inputs and parameters?
Right click with your mouse button in the chart with the indicator attached onto it.
From the drop down menu, click on indicators list.
Select the indicator from the list and press edit.
Now you can edit the indicator.
Finally, press the OK button to save the updated configuration.