
Automatic Regression Channel is a buy/sell Forex indicator for MT4 that draws a regression channel on the activity chart.
The channel will dynamically update its slope according to the underlying trend.
Key Points:
- The trend is rising when the channel’s slope is rising.
- The trend is declining when the channel’s slope is declining.
This indicator type is popular among scalpers and day trading.
It gives you an idea where to enter and exit a trade in both rising and declining currency markets.
Free Download
Download the “automatic-regression-channel-v2.mq4” indicator for MT4
Indicator Example Chart (EUR/USD M5)
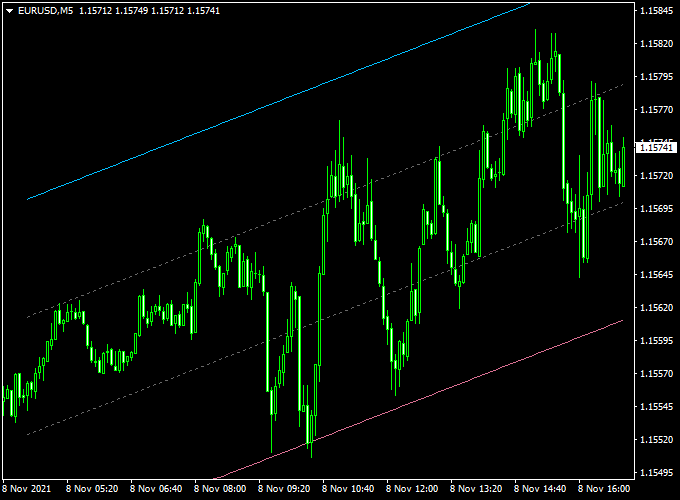
How to trade with it (example)?
Open a buy trade as soon as price touches the lower violet colored regression line and the Automatic Regression Channel’s slope is upwards.
Open a sell trade as soon as price touches the upper bue colored regression line and the Automatic Regression Channel’s slope is downwards.
Exit the trade at the opposite regression line.
Feel free to use your own favorite trading method to open and close trades with the Automatic Regression Channel Forex indicator.
Indicator Specifications
Trading Platform: Developed for Metatrader 4 (MT4)
Currency pairs: Works for any pair
Time frames: Works for any time frame
Input Parameters: Channel period, use high low, color settings & style
Indicator type: channel
Repaint? Dynamically updates the regression channel with the underlying trend.
Download Now
Download the “automatic-regression-channel-v2.mq4” indicator for Metatrader 4
Installation:
Open the Metatrader 4 platform
From the top menu, click on “File”
Then click on “Open Data Folder”
Then double click with your mouse button on “MQL4”
Now double click on “Indicators”
Paste the automatic-regression-channel-v2.mq4 indicator in the Indicators folder.
Finally restart the MT4 platform and attach the indicator to any chart.
How to remove the indicator?
Click with your right mouse button in the chart with the indicator attached onto it.
Select “Indicator List” from the drop down menu.
Select the indicator and press delete.
How to edit the indicator’s inputs and parameters?
Right click with your mouse button in the chart with the indicator attached onto it.
From the drop down menu, click on indicators list.
Select the indicator from the list and press edit.
Now you can edit the indicator.
Finally, press the OK button to save the updated configuration.