
The Automated Trend Lines indicator for Metatrader 5 analyses the price chart and draws the best support and resistance trend lines on autopilot.
The indicator can help traders to buy or sell trend breakouts that occur above the upper blue-colored resistance trend line or below the lower red-colored support trend line.
How does it work?
- A candle close above the blue resistance trend line generates a bullish signal.
- A candle close below the red support trend line generates a bearish signal.
For short-term traders (M1/M5): deploy the Automated Trend Lines indicator during the London and New York trading sessions for best results.
The indicator contains the following inputs and parameters: line type, left side, right side, offset, support line color, and resistance line color.
Please make yourself familiar with this technical indicator and test it first on a demo account.
Download Indicator 🆓
autotrendlines.mq5 Indicator (MT5)
Chart Example
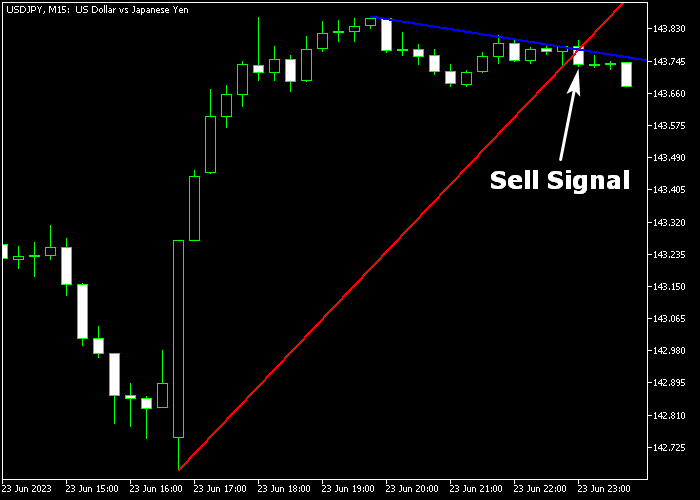
The following picture shows how the Automated Trend Lines indicator looks like when applied to the MT5 chart.
How To Buy And Sell Forex Pairs With The Automated Trend Lines Indicator?
Find a simple trading example below:
Buy Signal
- Buy a candle close above the blue colored resistance trend line.
- Place a protective stop loss below the previous swing low region.
- Close the buy trade for a potential reward-to-risk ratio of 1.5, or utilize a fixed profit target.
Sell Signal
- Sell a candle close below the red colored support trend line (see chart example above).
- Place a protective stop loss above the previous swing high region.
- Close the sell trade for a potential reward-to-risk ratio of 1.5, or utilize a fixed profit target.
Download Now 🆓
autotrendlines.mq5 Indicator (MT5)
Frequently Asked Questions
How Do I Install This Custom Indicator On Metatrader 5?
- Open the MT5 trading platform
- Click on the File menu button located at the top left part of the platform
- Click on Open Data Folder > MQL5 folder > Indicators
- Copy the autotrendlines.mq5 indicator file in the Indicators folder
- Close and restart the trading platform
- You will find the indicator here (Navigator window > Indicators)
- Drag the indicator to the chart to get started with it!
How Do I Edit This Indicator?
- Click in the open chart with your right mouse button
- In the dropdown menu, click on Indicator List
- Select the indicator and click on properties
- Now you can edit the inputs, colors, levels, scale and visualization
- Finally click the OK button to save the new configuration