The ATR Probability Levels Forex indicator for Metatrader 5 draws buy and sell probability trend levels on the chart based on Average True Range.
The indicator could give you an early indication where to set take profit levels for both long and short trades.
How does it work?
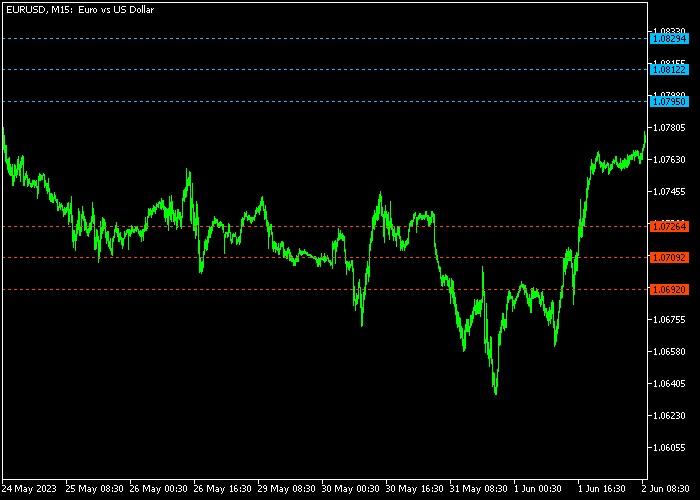
- The blue colored lines represent possible profit target levels for buy trades.
- The red colored lines represent possible profit target levels for short trades.
The indicator allows customizing the following settings and parameters: time frame for data, ATR period, colors, labels shift.
Please make yourself familiar with this technical indicator and test it first on a demo account before using it on real trading account.
Download Indicator 🆓
ATR Probability Levels.mq5 Indicator (MT5)
Chart Example
The following chart shows what the ATR Probability Levels indicator looks like when applied to the MT5 chart.

How To Buy And Sell Currency Pairs With The ATR Probability Levels Forex Indicator?
Find a simple trading example below:
Buy Signal
- Utilize your own trading strategy for spotting buy trades.
- The blue colored ATR Probability Levels can be used for setting take profit targets for buy trades.
Sell Signal
- Utilize your own trading strategy for spotting sell trades.
- The red colored ATR Probability Levels can be used for setting take profit targets for sell trades.
Download Now 🆓
ATR Probability Levels.mq5 Indicator (MT5)
Frequently Asked Questions
How Do I Install This Custom Indicator On Metatrader 5?
- Open the MT5 trading platform
- Click on the File menu button located at the top left part of the platform
- Click on Open Data Folder > MQL5 folder > Indicators
- Copy the ATR Probability Levels.mq5 indicator file in the Indicators folder
- Close and restart the trading platform
- You will find the indicator here (Navigator window > Indicators)
- Drag the indicator to the chart to get started with it!
How Do I Edit This Indicator?
- Click in the open chart with your right mouse button
- In the dropdown menu, click on Indicator List
- Select the indicator and click on properties
- Now you can edit the inputs, colors, levels, scale and visualization
- Finally click the OK button to save the new configuration