Chart patterns are a very powerful trading tool when it comes to forex or any other financial market.
This is what the Ascending/Descending chart pattern indicator for Metatrader 4 is all about.
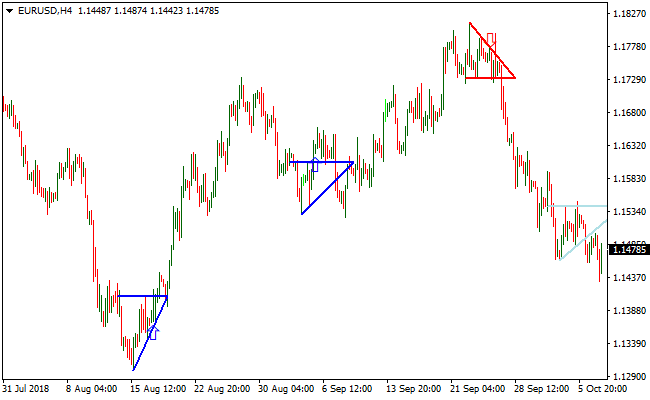
This chart pattern indicator identifies ascending and descending triangles on any MT4 chart and displays it on the chart together with an arrow to buy or to sell.
This indicator makes it easy to anyone to trade breakouts from ascending and descending triangles.
Target price is calculated as follows:
Entry price + the total pattern height for a buy trade (upward breakout)
Entry price – the total pattern height for a sell trade (downward breakout)
Stop-loss:
Buy trade: set a stop-loss a few pips below the low price of the chart pattern
Sell trade: set a stop-loss a few pips above the high price of the chart pattern
Free Download
Download the “breakout-pattern.mq4” MT4 indicator
Example Chart
The EUR/USD 4-Hour chart below displays the Ascending/Descending chart pattern Metatrader 4 Forex indicator in action.
Basic Trading Signals
Signals from the Ascending/Descending chart pattern MT4 forex indicator are easy to interpret and goes as follows:
Buy Signal: Initiate a long trade when a blue arrow appears on the chart.
Sell Signal: Initiate a short trade when a red arrow appears on the chart.
Trade Exit: follow the stop-loss and take profit rules as explained above.
Download
Download the “breakout-pattern.mq4” Metatrader 4 indicator
MT4 Indicator Characteristics
Currency pairs: Any
Platform: Metatrader 4
Type: Chart pattern indicator
Customization options: Variable (numbers of bars, alert) Colors, width & Style.
Time frames: 1-Minute, 5-Minutes, 15-Minutes, 30-Minutes, 1-Hour, 4-Hours, 1-Day, 1-Week, 1-Month
Type: chart pattern
Installation
Copy and paste the breakout-pattern.mq4 into the MQL4 indicators folder of the Metatrader 4 trading platform.
You can access this folder from the top menu as follows:
File > Open Data Folder > MQL4 > Indicators (paste here)


