
The ADX Crossing Forex Signal indicator for Metatrader 5 is a powerful dots trading system that offers reliable trading signals to currency traders.
ADX stands for Average directional movement index.
The indicator presents a colored dots trading system that alternates between a clear buy signal and sell signal.
How to trade with the ADX Crossing indicator?
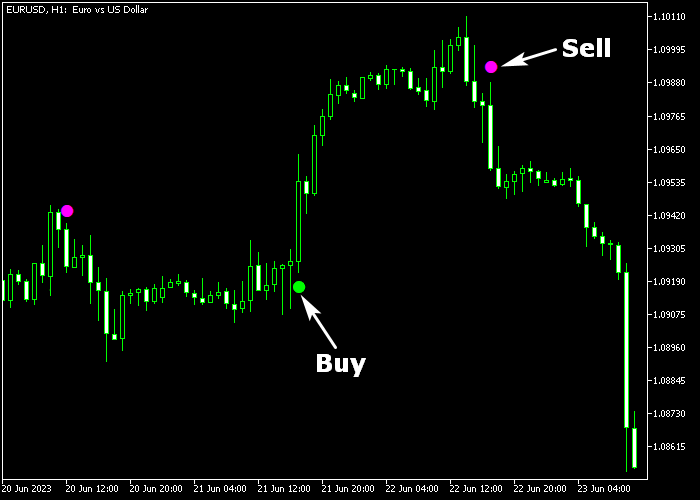
- A colored green dot generates a buy trade.
- A colored purple dot generates a sell trade.
The indicator works equally well for newbies and seasoned traders alike.
The indicator contains the following inputs and parameters: ADX period (50).
Make yourself familiar with this technical indicator and test it first on a demo account before applying it to a live account.
It supports all time frames and Forex pairs.
Download Indicator 🆓
adxcrossing.mq5 Indicator (MT5)
Chart Example
The following chart shows what the ADX Crossing Forex Signal indicator looks like when applied to the MT5 chart.
How To Buy And Sell Forex Pairs With The ADX Crossing Signal Indicator?
Find a simple trading strategy below:
Buy Signal
- A buy signal is generated when the green colored ADX Crossing dot gets shown in the chart.
- Open a buy transaction and place your stop loss below the most recent support level.
- Exit the buy trade for a fixed pip profit target, or wait for a sell signal.
Sell Signal
- A sell signal is generated when the purple colored ADX Crossing dot gets shown in the chart.
- Open a sell transaction and place your stop loss above the most recent resistance level.
- Exit the sell trade for a fixed pip profit target, or wait for a buy signal.
Download Now 🆓
adxcrossing.mq5 Indicator (MT5)
Frequently Asked Questions
How Do I Install This Custom Indicator On Metatrader 5?
- Open the MT5 trading platform
- Click on the File menu button located at the top left part of the platform
- Click on Open Data Folder > MQL5 folder > Indicators
- Copy the adxcrossing.mq5 indicator file in the Indicators folder
- Close and restart the trading platform
- You will find the indicator here (Navigator window > Indicators)
- Drag the indicator to the chart to get started with it!
How Do I Edit This Indicator?
- Click in the open chart with your right mouse button
- In the dropdown menu, click on Indicator List
- Select the indicator and click on properties
- Now you can edit the inputs, colors, levels, scale and visualization
- Finally click the OK button to save the new configuration